
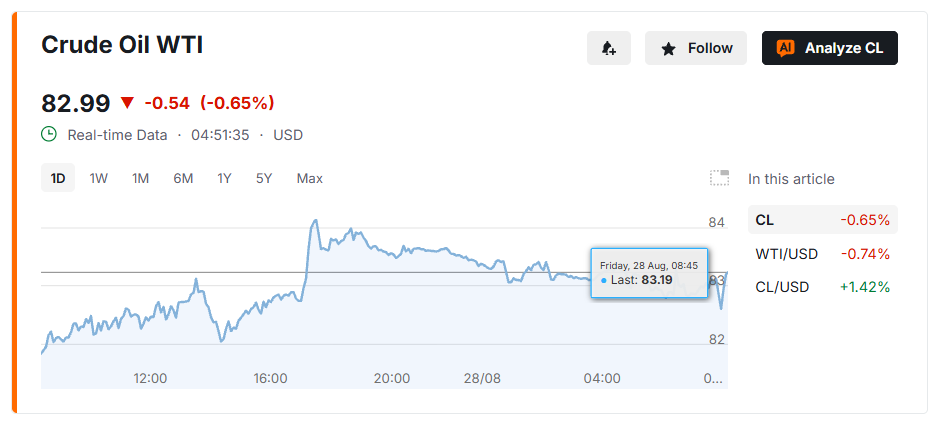
Crude Oil WTI is consolidating tightly at $83.10 on the 5-hour chart, pinned between its 20-period moving average and 50-period moving average inside the Ichimoku cloud. The stall follows a month in which WTI climbed from roughly $78.63 to current levels, a gain near 5%, driven largely by Middle East supply disruptions tied to the Strait of Hormuz. With volatility compressed and momentum absent, the range is set up for a breakout that could move fast once it starts.
Trapped Inside the Cloud
The technical setup is a genuine standoff. Support sits at the 20-SMA near $82.77, while resistance holds at the 50-SMA near $83.75, with the Ichimoku cloud itself spanning $82.87 to $83.65. Price remains above its 200-SMA at $80.21, meaning the longer-term uptrend is intact even as short-term momentum stalls. Recent Doji candlesticks forming near $82.90 reinforce that neither buyers nor sellers currently have control. This pause comes as WTI trades within a 52-week range of $54.98 to $117.63, underscoring how much room remains on either side of the current squeeze. Average True Range has fallen to just 1.47%, confirming that volatility is unusually compressed for a market still shadowed by geopolitical risk.
- Support: $82.77 (20-SMA)
- Resistance: $83.75 (50-SMA)
- Cloud range: $82.87–$83.65
Breakout Setups on Both Sides
A bullish breakout gains traction on a close above $84.00, ideally confirmed by a retest near $84.00 before continuation, with volume expansion and RSI above 60 as validation signals. A stop below $82.17 protects against a failed breakout, and targets extend to $86.74, $87.69, and $90.00, with the first target offering roughly 1.5:1 risk-to-reward. The bearish case builds on a close below $82.00, or more conservatively a clean break of the 50% Fibonacci level near $80.80. Confirmation comes from a bearish MACD cross and ADX pushing above 25, with a stop at $83.83 and downside targets at $79.25, $76.00, and $74.24 — the same 1.5:1 ratio applies to the first target. Traders should note that old support near the 200-SMA and major Fibonacci levels has a history of sparking sharp reversals, so bearish entries carry elevated risk near those zones.
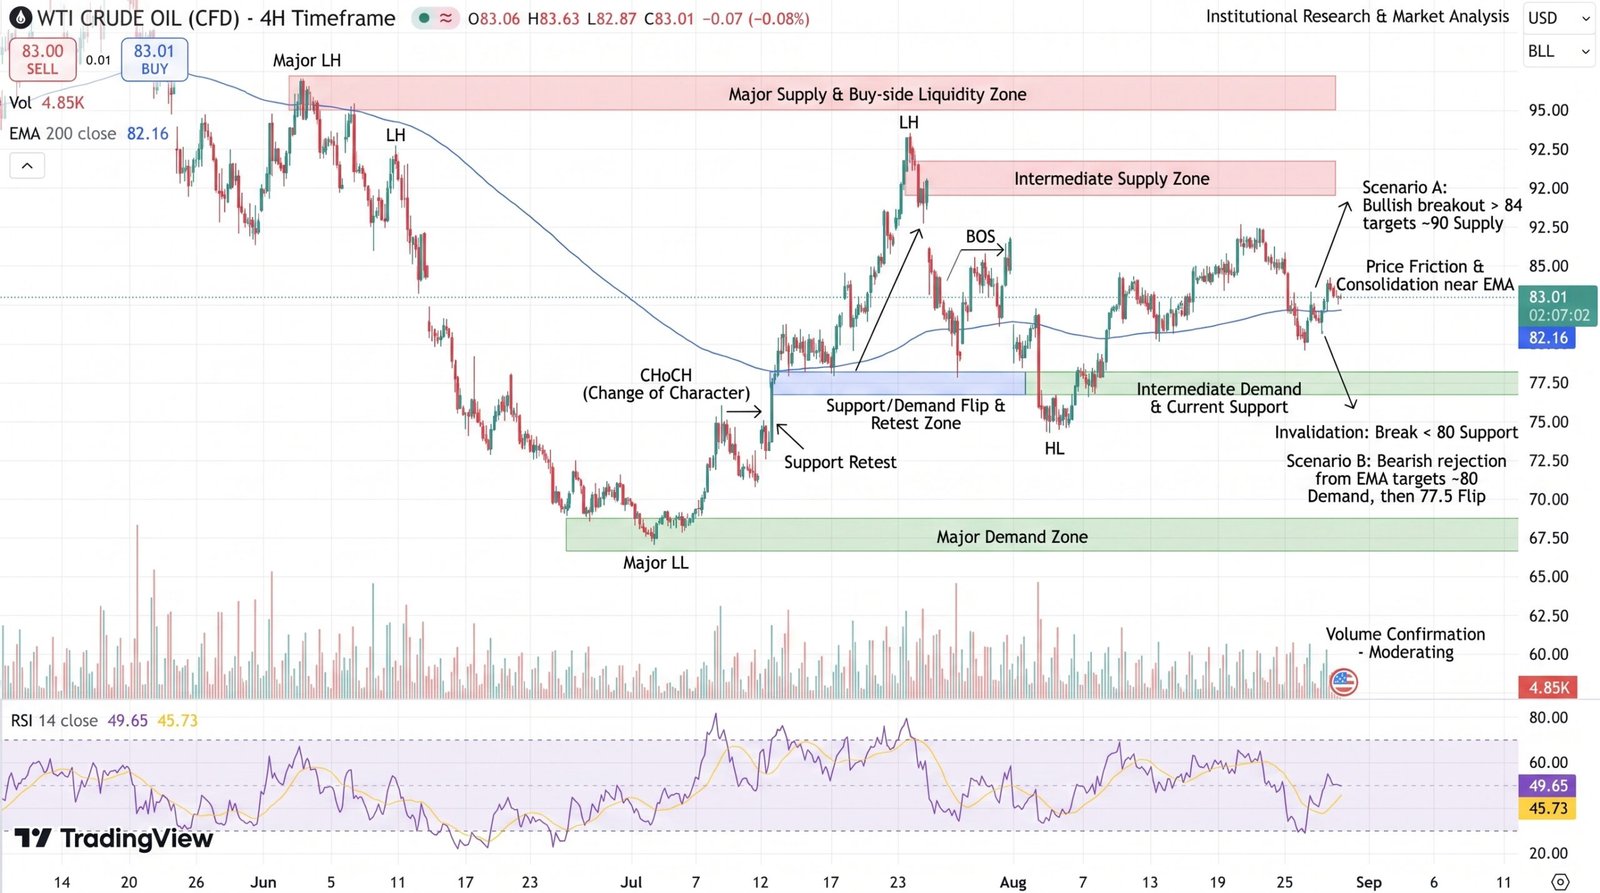
Ongoing developments around Iran and the Strait of Hormuz remain the biggest wildcard. Reports of technical talks between Iran and Oman over a temporary maritime corridor have already pressured prices lower in recent sessions, showing how quickly headlines can override the technical range entirely.
Conclusion: Let the Range Resolve Before Acting
The $82.00–$84.00 band is a textbook no-trade zone: low ATR, declining volume, and indecisive candles all point to false moves before any real trend emerges. History shows breakouts from tight, low-volatility ranges frequently start with a fakeout before genuine momentum builds behind them. The disciplined approach is to wait for price to clear the range with volume and momentum confirmation from RSI or MACD, rather than anticipating the move — a strategy that avoids the repeated stop-outs that come from trading inside compressed, headline-sensitive ranges like this one.
Sources & Methodology
Primary-source standard: Market-moving facts should link to original data releases, regulator notices, company filings or official project announcements whenever available. Secondary reporting is used for additional context, not as a substitute for original evidence.
Page last reviewed: