
Ethereum (ETH) briefly slipped below $2,000 on Thursday as cryptocurrency investors faced persistent selling pressure, weak institutional demand and continued uncertainty across risk-sensitive markets. The token was trading near $2,015 after falling approximately 3%, with derivatives liquidations adding to market volatility. US spot Ether exchange-traded funds (ETFs) also recorded substantial withdrawals, while the Coinbase Premium Index remained negative, indicating continued weakness in US trading demand. With ETH trading below several major moving averages, the $1,970 support level has become an important test for the market.
ETF Outflows and Liquidations Weigh on ETH
Ethereum’s latest decline reflects a combination of institutional withdrawals and leveraged traders reducing exposure. According to the figures cited in the supplied market report, US spot Ether ETFs recorded $144.8 million in net outflows on Wednesday. The products have reportedly registered only one day of net inflows since the beginning of November.
ETF outflows indicate that investors are withdrawing more capital from these products than they are adding. Sustained withdrawals can weaken institutional demand for Ether, although daily flows alone do not establish the direction of the longer-term market.
Derivatives activity has also intensified the decline. CoinGlass data cited in the report showed $126.7 million in ETH-related liquidations over 24 hours, including $103.9 million in liquidated long positions. Long liquidations occur when leveraged traders betting on higher prices are forced to close their positions after the market moves against them.
The Coinbase Premium Index has also remained negative since early September, according to the supplied report. The indicator compares Coinbase’s Bitcoin price with prices on other exchanges and is commonly used to assess US trading demand. However, it measures Bitcoin market conditions rather than Ethereum-specific buying pressure, so it should not be treated as direct evidence of ETH selling by US investors.
Ethereum Technical Outlook: $1,970
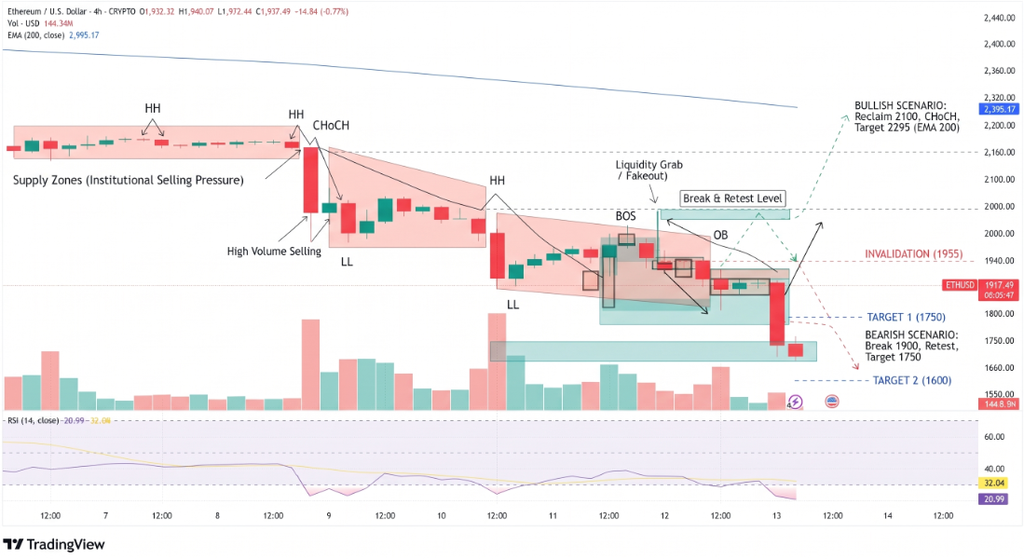
ETH’s daily chart remains bearish, with the token trading below its 20-, 50- and 100-day Exponential Moving Averages (EMAs), clustered between approximately $2,220 and $2,330. These averages indicate that the prevailing trend remains weak and that recovering lost ground could prove difficult.
Momentum indicators suggest selling may be stretched. The 14-day Relative Strength Index (RSI) stands near 28, below the conventional 30 threshold associated with oversold conditions. The Stochastic Oscillator is around 7, also indicating deeply negative momentum.
Important technical levels include:
- Immediate support: $1,971.
- Lower support: $1,827 and $1,706.
- Initial resistance: $2,101.
- Additional resistance: $2,204–$2,250.
- Major EMA resistance: $2,320–$2,334.
A sustained break below $1,971 could expose the lower support zones. Conversely, a recovery above $2,101 would provide an initial sign that buyers are attempting to stabilize the market.
Institutional Demand Remains Critical
Ethereum’s near-term direction will depend partly on whether ETF withdrawals begin to moderate and whether leveraged selling loses momentum. A recovery in institutional inflows could improve market confidence, while continued withdrawals may restrict attempts to reclaim important resistance levels.
Conclusion
Ethereum remains vulnerable near $2,000 as ETF outflows, liquidations and weak technical momentum weigh on sentiment. The $1,970 level is the immediate downside threshold, with $1,827 and $1,706 representing further support if sellers push prices lower. A move above $2,101 would offer an early recovery signal, but ETH needs to reclaim its major moving averages to establish a more convincing bullish reversal.
Sources & Methodology
Primary-source standard: Market-moving facts should link to original data releases, regulator notices, company filings or official project announcements whenever available. Secondary reporting is used for additional context, not as a substitute for original evidence.
Page last reviewed: