Quick Answer
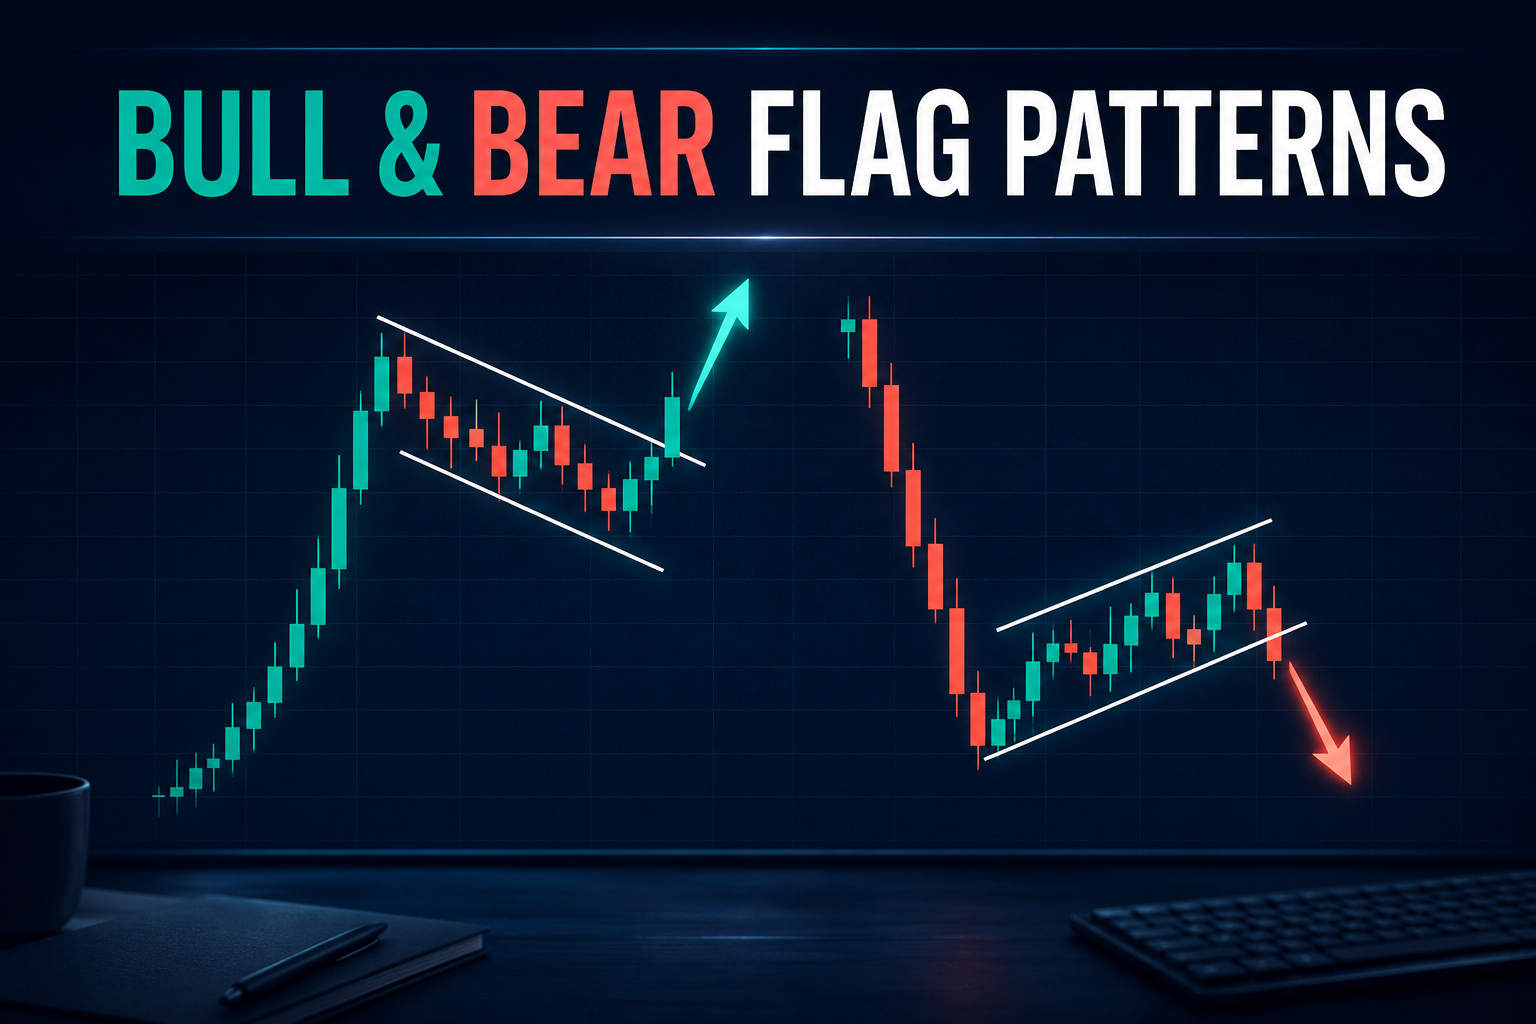
A flag pattern is a continuation chart pattern that forms after a strong directional move, called the flagpole, followed by a short consolidation that slopes against the prior trend or drifts sideways, called the flag. A bull flag appears after a sharp rise and may lead to another push higher if price breaks above flag resistance. A bear flag appears after a sharp drop and may continue lower if price breaks below flag support. Traders normally wait for a confirmed breakout, then use the flag structure to set the stop and project a potential target using the height of the original flagpole.
Why Flag Patterns Matter
Flag patterns are popular because they are simple without being simplistic. They tell a coherent market story: a strong move attracts momentum traders, price pauses while the market absorbs gains or losses, and then the trend may resume once that pause is complete.
In forex, that logic can be especially useful because currency pairs often trend in waves rather than in straight lines. A clean flag can help a trader distinguish a normal pullback from a full reversal. That matters because many losing trades start with a correct trend view but poor entry timing. Newer traders can first review this step-by-step forex trading guide for the broader foundations.
What Is a Flag Pattern?
A flag pattern has two main parts:
- The flagpole: the strong impulse move that shows clear directional momentum.
- The flag: a smaller countertrend or sideways channel that reflects temporary consolidation.
The flag usually slopes against the prior move. In a bullish setup, the flag often drifts slightly lower or sideways. In a bearish setup, it often drifts slightly higher or sideways. The pattern works because the pause shows that the trend has slowed—not necessarily ended. If price breaks in the direction of the original trend, the market is effectively saying the pause is over. For a broader framework on trends and chart structure, see the Forex Technical Analysis guide.
Common Characteristics Traders Look For in a Flag
- A clear and relatively sharp flagpole rather than a messy grind.
- A compact flag that lasts less time than the flagpole and does not retrace too deeply.
- Parallel or near-parallel boundaries that make the consolidation easy to map.
- A breakout in the direction of the original move, ideally with strong candle structure or momentum confirmation.
- Enough room to the next major support or resistance level to make the trade worthwhile.
Bull Flag Pattern Explained
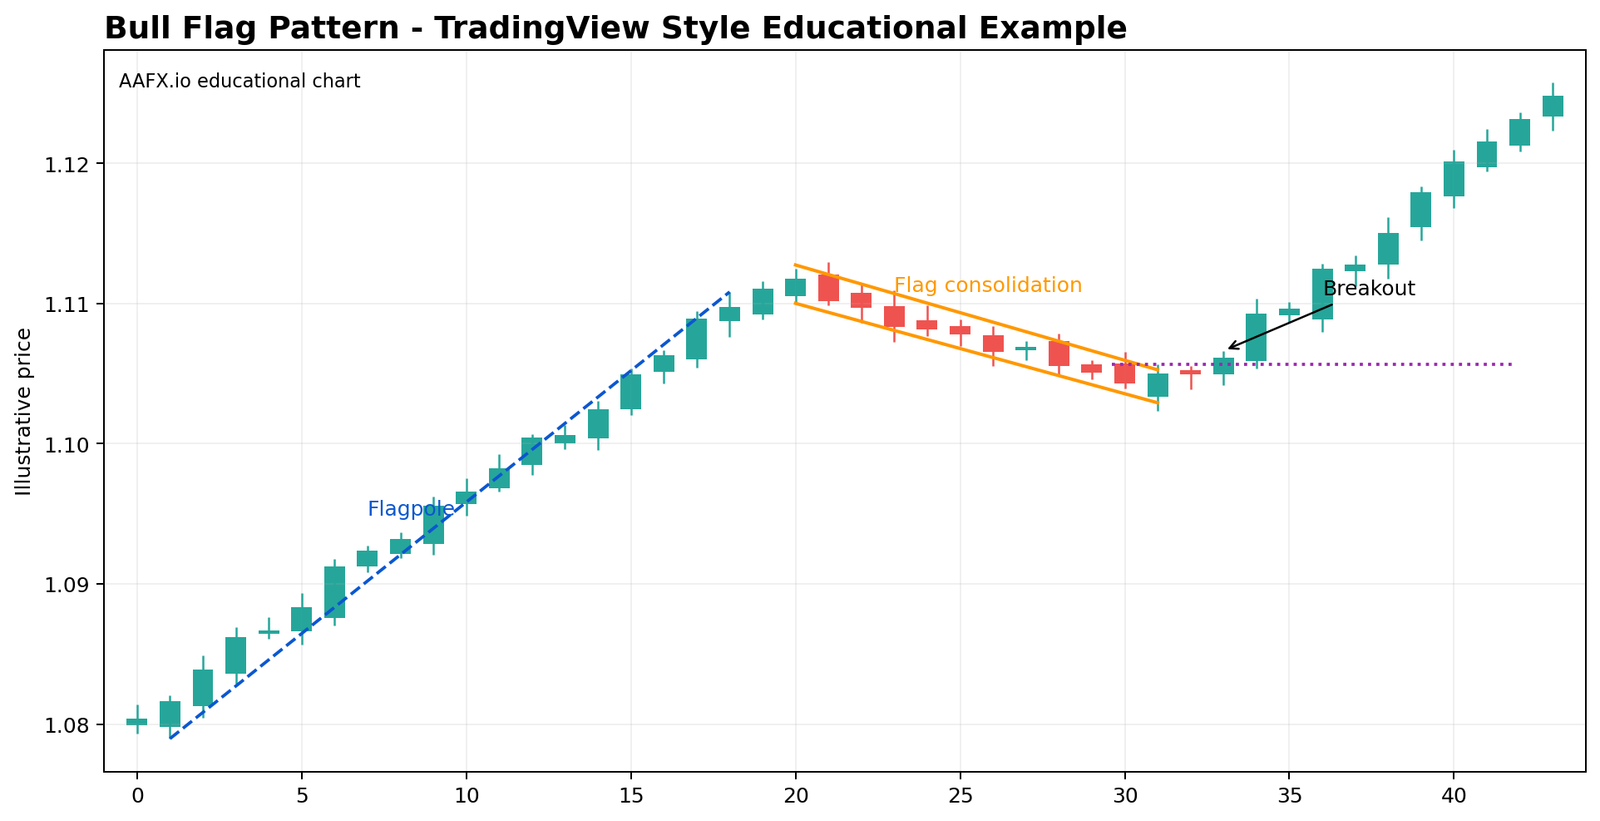
A bull flag appears after a strong rise. Buyers push price higher aggressively, then the market pauses. During that pause, price typically drifts lower or sideways inside a small channel. This consolidation is the flag.
The important detail is context. A bull flag is not simply any downward channel. It needs to appear after a meaningful impulsive move. Without that flagpole, the pattern loses much of its continuation logic.
Many beginners try to buy too early while price is still consolidating. A more cautious approach is to wait until price closes above the upper edge of the flag or at least clearly reclaims resistance. That does not guarantee success, but it may help filter some premature entries while the pullback is still developing.
Bear Flag Pattern Explained
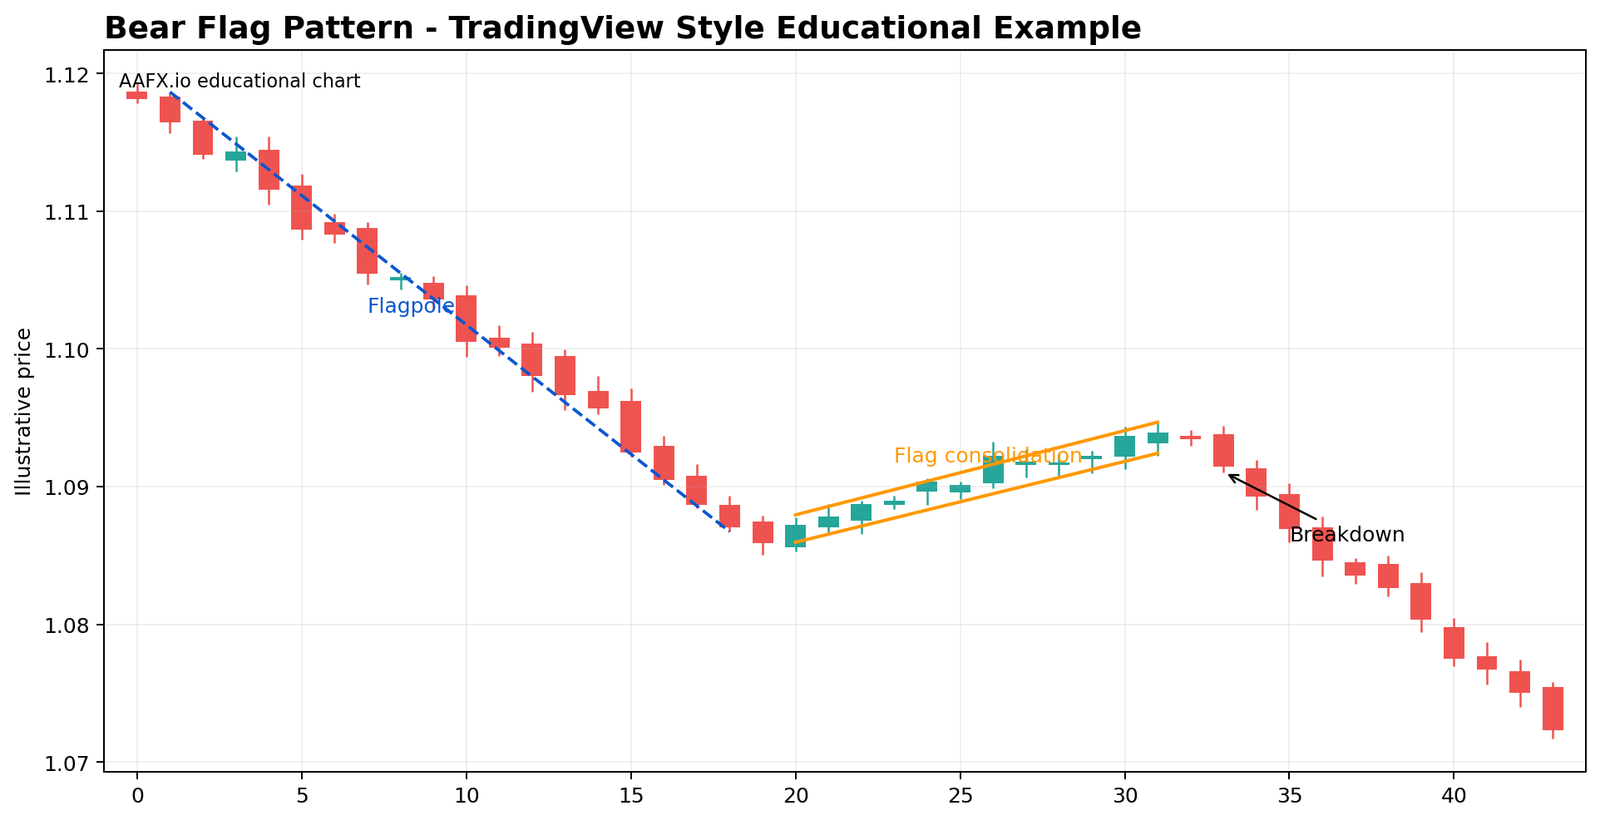
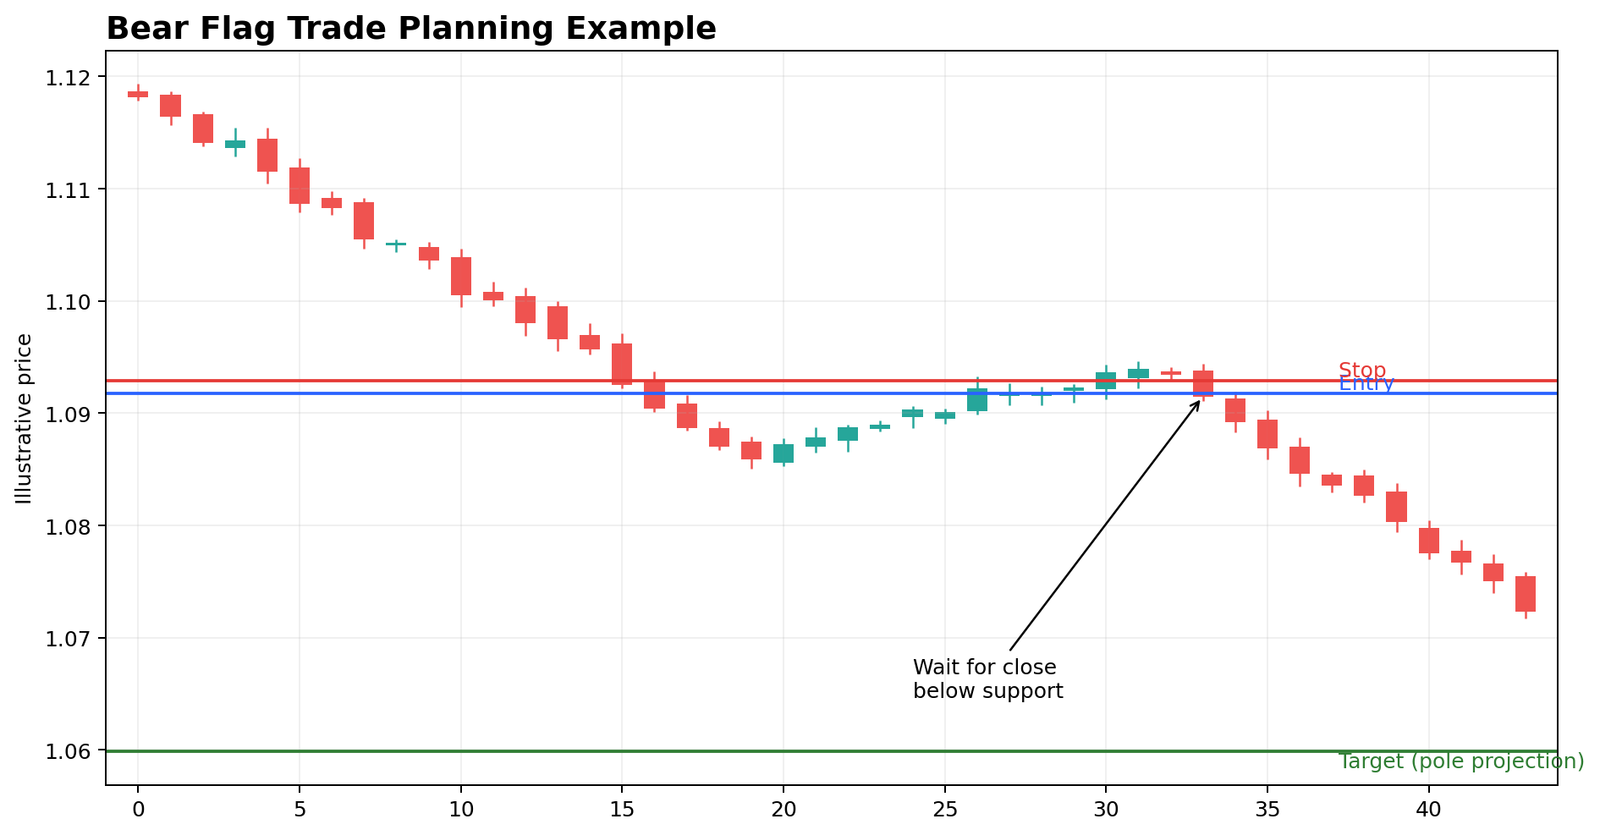
A bear flag is the mirror image. Price falls sharply, then pauses in a small upward-sloping or sideways consolidation. If the broader bearish momentum returns and price breaks below the lower boundary of the flag, the pattern may continue lower.
Again, context matters more than the label. A rising channel by itself is not a bear flag. It becomes one only when it follows a sharp bearish impulse and serves as a pause rather than as a genuine trend reversal.
Bear flags can be especially useful for traders who struggle with the psychological urge to “bottom fish.” The pattern provides a more objective way to say: this recovery still looks like a pause, not a reversal. Our guide to trading psychology and discipline explains how rules can reduce emotionally driven decisions.
How to Identify a Flag Pattern Step by Step
- Find a clear impulse move. The chart should show obvious directional momentum before the consolidation begins.
- Draw the flag boundaries. Use the swing highs and lows of the consolidation to map the channel or small rectangle.
- Check the retracement depth. Shallow to moderate pullbacks usually fit better than deep retracements that erase most of the flagpole.
- Look at market context. Is the larger trend aligned with the pattern? Is the pair approaching a major support or resistance zone?
- Wait for the breakout. Many failed trades come from anticipating the breakout rather than waiting for confirmation.
- Plan the stop and target before entry. The pattern becomes more useful when it also gives a clear invalidation point.
How to Trade a Bull Flag
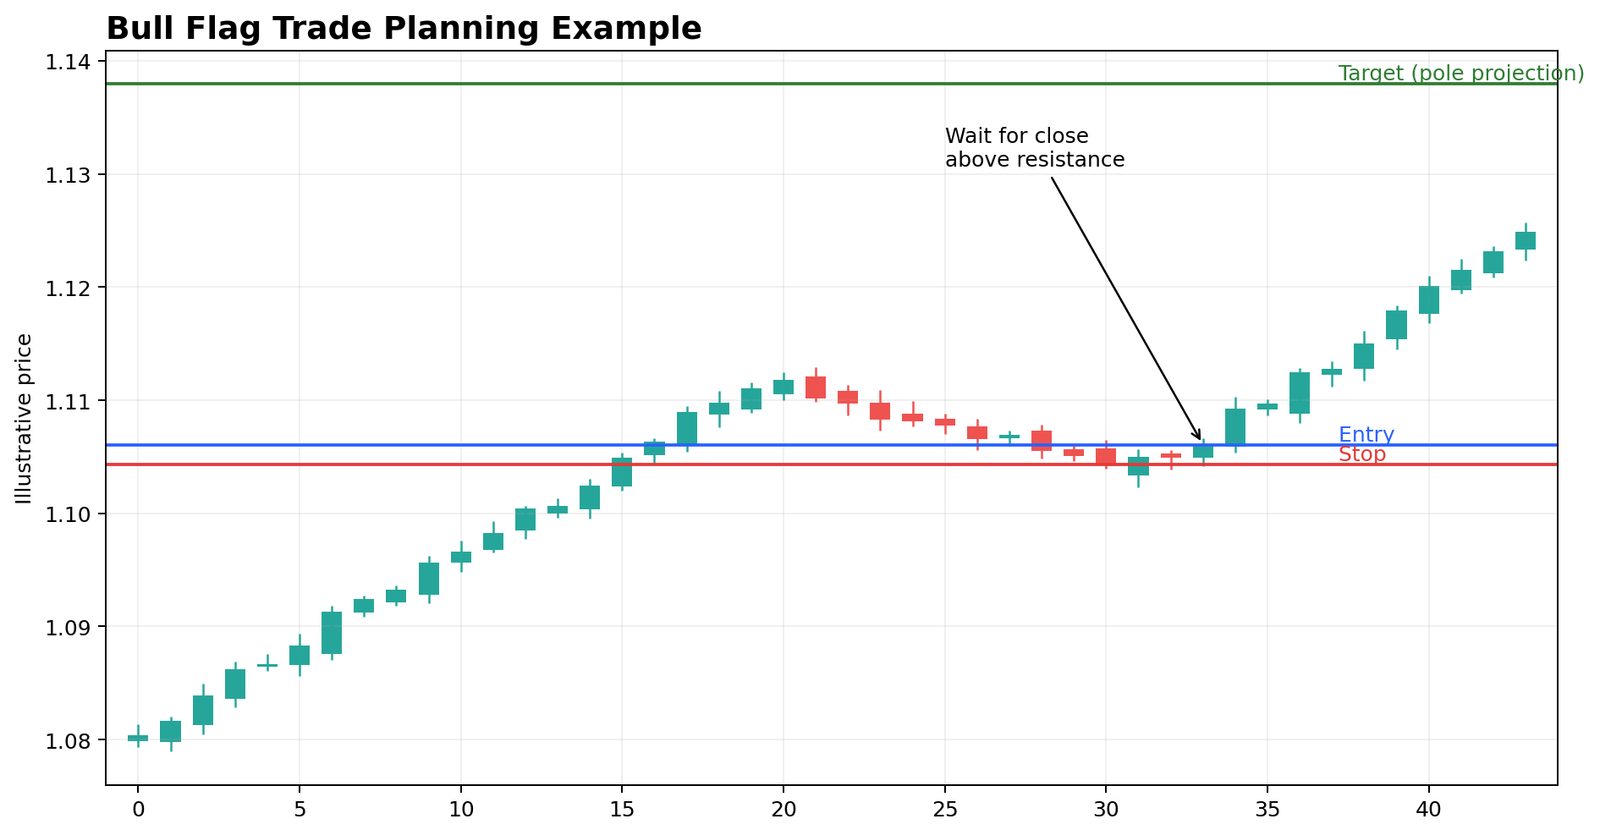
A practical bull-flag trade usually has three moving parts: entry, stop and target.
Entry
A common entry is above the upper edge of the flag once price closes or breaks clearly above resistance. More conservative traders may wait for a breakout and then a brief retest of the broken line. More aggressive traders may use a buy stop just above the channel high.
Stop-Loss
The stop is often placed below the lower boundary of the flag or below the most recent swing low inside the consolidation. The precise location should reflect the setup structure, not a random number of pips.
Target
A common target uses the height of the flagpole projected from the breakout point. That does not mean price must travel the full distance, but it gives the trader a logical benchmark.
How to Trade a Bear Flag
The bearish version follows the same logic in reverse.
Entry
A typical entry is below the lower boundary of the flag after a bearish breakout candle or via a sell stop below support.
Stop-Loss
The stop is usually placed above the top of the flag or above the nearest swing high inside the consolidation. This defines the point where the bearish continuation idea is no longer valid.
Target
As with the bull flag, many traders project the height of the flagpole from the breakout point to estimate a potential downside objective.
Best Timeframes for Trading Flag Patterns
| Trading style | Common timeframes | Main consideration |
|---|---|---|
| Scalping | 1m to 15m | Signals come faster, but noise and false breaks increase. |
| Day trading | 15m to 1H | A useful balance between frequency and structure for many traders. |
| Swing trading | 4H to Daily | Patterns are usually cleaner but take longer to complete. |
| Position trading | Daily to Weekly | Used mainly for broader trend continuation rather than frequent entries. |
There is no single best timeframe. Lower timeframes offer more opportunities but also more noise. Many traders find that higher timeframes produce easier-to-read structures, although this is a practical observation rather than a universal performance rule, and the patterns take longer to complete. The right choice depends on your strategy, schedule and risk tolerance.
Should You Use Volume With Flag Patterns?
In stocks and futures, traders often look for strong volume on the flagpole, lighter volume during the consolidation and rising volume on the breakout. In spot forex, centralized exchange volume is not available in the same way because the market is predominantly over-the-counter, decentralized and fragmented. Many traders therefore use price action, candle strength, momentum indicators or broker-provided tick volume as supporting clues rather than as a strict requirement. Broker tick volume is specific to that broker, venue or data feed and does not represent the entire FX market. See the BIS analysis of the 2025 FX execution landscape.
Useful Confirmation Tools
- Support and resistance: a breakout that also clears a key level can be more convincing.
- Moving averages: a flag that forms above a rising average in an uptrend or below a falling average in a downtrend can fit the broader structure better.
- Momentum indicators: tools such as RSI or MACD can help judge whether momentum has returned, though they should not replace price action.
- Candlestick confirmation: a strong breakout candle or a successful retest can improve the quality of the setup.
False Breakouts and Failed Flags
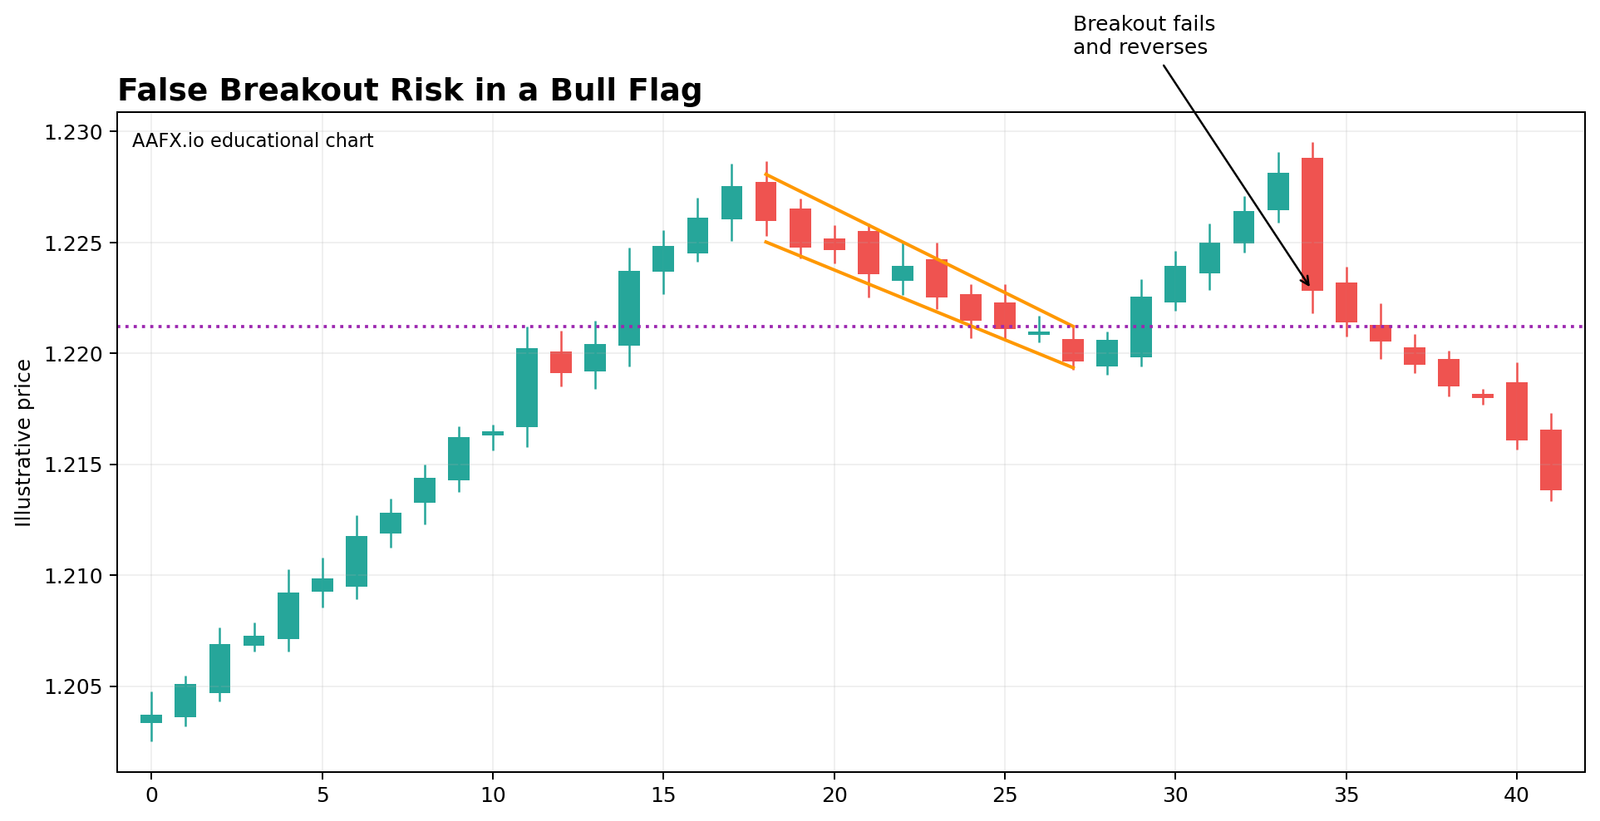
Not every flag continues. Sometimes price breaks out briefly, attracts traders and then snaps back into or through the pattern. That is the classic false-breakout problem.
Waiting for a candle close, a retest or a strong structural break provides additional confirmation and may help filter some premature entries. It does not eliminate risk, and false breakouts still occur.
A failed bull flag can become especially dangerous when traders buy the first push above resistance without noticing that the breakout lacks follow-through. The bearish version can do the same on the downside.
Warning Signs of a Lower-Quality Flag
- The flag retraces too deeply into the flagpole.
- The consolidation becomes too long and messy.
- The breakout occurs directly into a major support or resistance barrier.
- Price keeps wicking through the flag boundaries with no clean structure.
- The larger market context argues against continuation, such as a major macro event or an obvious higher-timeframe reversal zone.
How Reliable Are Bull and Bear Flags?
Flag patterns are widely followed because they are visually clear and logically consistent. But there is no universal, defensible success rate for forex bull or bear flags. Results depend on how the pattern, breakout, entry, stop and target are defined, as well as the currency pair, timeframe, sample period, trading costs and news environment. Published research on technical trading rules in foreign exchange reports rule-dependent results, but it does not establish a specific win rate for flag patterns.
A clean flag can make entry, invalidation and target rules easier to define than an unstructured pullback. That clarity is useful, but it is not proof of predictive edge. Traders should test an exact rule set on historical data and then on data not used to design the strategy.
Before Trusting a Flag-Pattern Win Rate
- Check the currency pairs, timeframe and sample period.
- Confirm the exact entry, stop, target and invalidation rules.
- Include spreads, commissions and realistic slippage.
- Look for out-of-sample testing, not only optimized historical results.
Common Flag-Pattern Mistakes
- Confusing any small channel with a true flag pattern.
- Buying or selling before the breakout actually happens.
- Ignoring the higher-timeframe trend or nearby support and resistance.
- Using the pattern without a defined stop-loss level.
- Assuming the measured target must always be reached.
- Forcing a flag label onto a messy chart because you want a trade.
- Trading a breakout immediately ahead of major economic news with no event-risk plan.
Flag Pattern vs. Pennant: What Is the Difference?
Flags and pennants are closely related continuation patterns, but the consolidation shape is different. A flag usually forms as a small parallel channel or rectangle. A pennant forms as a small converging triangle. The trading logic is similar: impulse move, pause and breakout in the trend direction. Separating them improves clarity and reduces the risk of forcing the wrong target or stop logic.
Frequently Asked Questions
What is a flag pattern in forex?
A flag pattern is a continuation pattern made up of a strong move, called the flagpole, followed by a smaller consolidation, called the flag, and then a breakout that often resumes the original trend.
What is a bull flag?
A bull flag forms after a strong rise. Price then pauses in a small downward or sideways channel before potentially breaking higher again.
What is a bear flag?
A bear flag forms after a strong drop. Price then pauses in a small upward or sideways channel before potentially breaking lower again.
How do you trade a flag pattern?
Traders commonly wait for a breakout from the flag, place the stop beyond the opposite side of the consolidation and use the flagpole height as one possible target method.
Are flag patterns reliable?
They can be useful and structurally clear, especially in trending markets, but they are not guaranteed. Context, confirmation and risk management remain essential.
What is the difference between a flag and a pennant?
A flag usually looks like a small parallel channel, while a pennant looks like a small converging triangle. Both are commonly treated as continuation patterns.
Do flag patterns work on all timeframes?
They can appear on many timeframes, but lower timeframes are noisier and higher timeframes are usually cleaner.
Should I use volume with flag patterns?
In stocks and futures, volume can help. In spot forex, traders often rely more on price action and other confirmation tools because centralized volume is not available in the same way.
How is the flag-pattern target measured?
A common method is to measure the height of the flagpole and project that distance from the breakout point.
Can a flag pattern fail?
Yes. False breakouts happen, which is why confirmation and stop-loss planning are important.
Bottom Line
Flag patterns turn a vague idea—the trend might continue—into a structured setup with a market story, an entry area, an invalidation level and a target framework. That makes them especially valuable for traders who want clean chart patterns rather than constant indicator noise.
More recognizable bull and bear flags generally show a strong impulse move, a compact consolidation and a clear breakout. Messy structures are harder to define consistently and easier to misclassify. The edge is often in the selectivity, not just in the pattern name.
Use this guide alongside the broader Forex Technical Analysis pillar and the AAFX.IO guides to leverage and trading risk and trading discipline to turn a recognisable pattern into a trade idea that is testable and manageable.
Risk warning: Forex and leveraged derivatives involve substantial risk. Chart patterns can fail, and false breakouts are common. This article is educational and not personalised financial advice.
Sources & Methodology
Sources used for this guide: Flag-pattern structure and measured-move conventions were checked against IG educational methodology and BabyPips pattern definitions. Reliability language is informed by published FX technical-analysis research, while the explanation of decentralized spot-FX volume uses the BIS 2025 execution-landscape analysis. These sources do not establish a universal flag-pattern success rate.
Page last reviewed: