Quick Answer
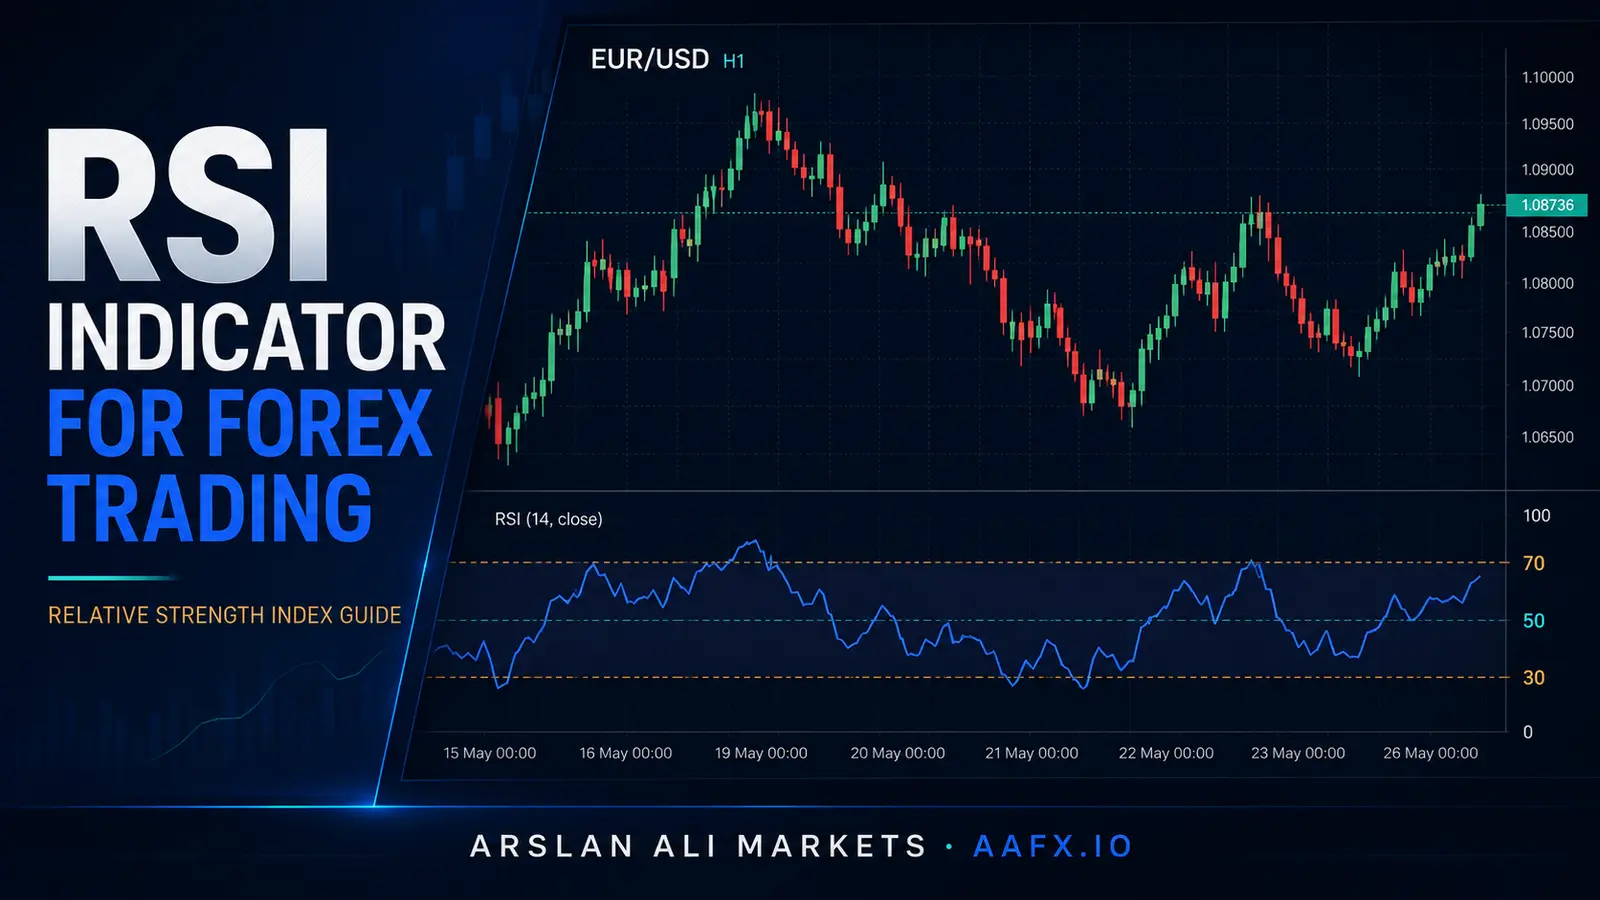
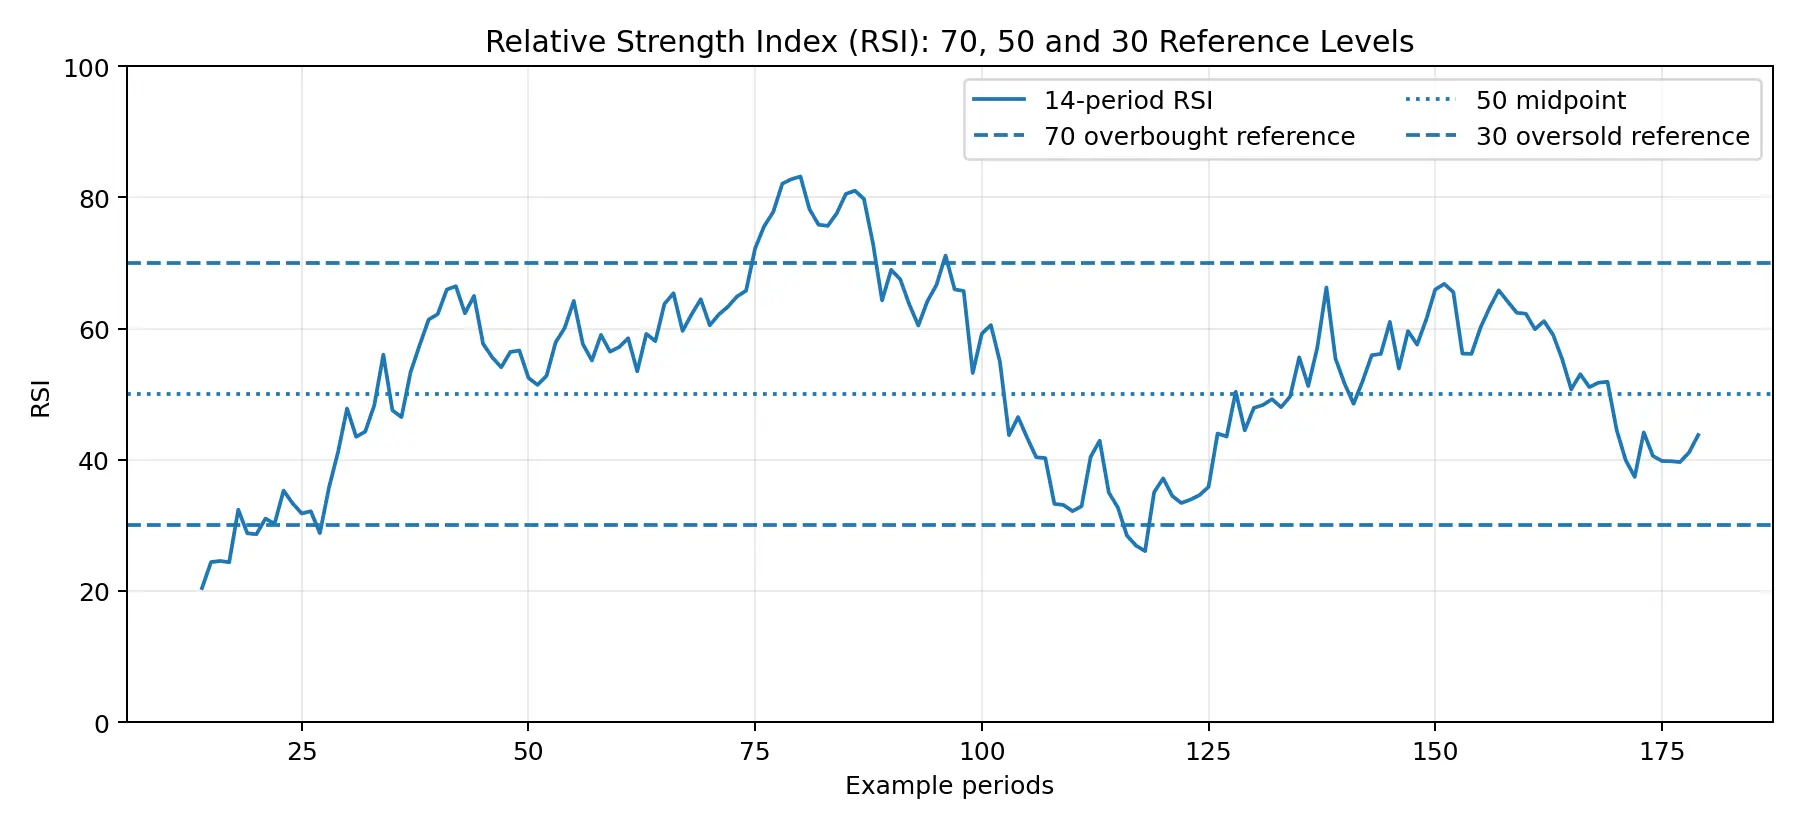
The Relative Strength Index (RSI) is a momentum oscillator that measures the speed and magnitude of recent price changes on a scale from 0 to 100. Traders commonly use 70 as an overbought reference, 30 as an oversold reference and 50 as a momentum midpoint. But RSI above 70 is not automatically a sell signal, and RSI below 30 is not automatically a buy signal. Strong trends can remain overbought or oversold for long periods. RSI becomes more useful when it is combined with market structure, support and resistance, trend direction, divergence and a clear invalidation level.
What Is the RSI Indicator?
The Relative Strength Index is a momentum indicator created by J. Welles Wilder Jr. and introduced in his technical-analysis work in the late 1970s. Unlike “relative strength” comparisons that measure one asset against another, RSI compares the strength of recent gains with recent losses in the same instrument.
In forex, RSI helps answer a practical question: is recent price momentum strong, weak or stretched relative to the pair’s own recent history? That makes it useful for range trading, pullback analysis, trend confirmation, divergence and momentum shifts.
This guide goes deeper than the RSI overview in the main AAFX.io Forex Technical Analysis guide. It covers the indicator from the basics – formula, 70/30 levels and the 50 midpoint – through settings, divergence, failure swings, confluence and practical forex strategies.
Who Created the Relative Strength Index?
J. Welles Wilder Jr. developed RSI as part of a broader set of technical tools that also included concepts behind ATR and the Directional Movement system. The default RSI lookback most platforms use today is 14 periods, but the indicator can be calculated on any timeframe and with different lookback lengths.
How Is RSI Calculated?
The RSI formula converts the ratio of average gains to average losses into a bounded 0-100 oscillator.
RSI = 100 – [100 / (1 + RS)]
RS = Average Gain / Average Loss
Wilder’s original method uses a 14-period lookback and a smoothing process after the first average gain and average loss are established. Most modern platforms perform this calculation automatically, so traders rarely calculate RSI by hand. Still, understanding the formula is useful because it explains why RSI rises when recent gains dominate and falls when recent losses dominate.
Simple Calculation Example
Suppose the smoothed average gain over the lookback is 0.0060 and the smoothed average loss is 0.0030. RS is 2.0. The RSI would be 100 – [100 / (1 + 2)] = 66.7. That indicates bullish momentum, but it is still below the traditional 70 overbought reference.
What Does RSI Show Traders?
| RSI observation | Common interpretation | Important limitation |
|---|---|---|
| Above 70 | Momentum is strong / traditionally “overbought” | Price can keep rising and RSI can stay above 70 |
| Below 30 | Momentum is weak / traditionally “oversold” | Price can keep falling and RSI can stay below 30 |
| Above 50 | Average gains are dominating average losses | Not a guaranteed uptrend by itself |
| Below 50 | Average losses are dominating average gains | Not a guaranteed downtrend by itself |
| Bullish divergence | Price weakens but RSI weakens less | Can appear early and persist before reversal |
| Bearish divergence | Price rises but RSI rises less | Can persist while trend remains strong |
| Failure swing | RSI forms a momentum reversal pattern | Best used with market structure and context |
RSI Overbought and Oversold Levels: 70 and 30
What Does RSI Above 70 Mean?
RSI above 70 means recent gains have been strong relative to recent losses. It is traditionally labelled “overbought,” but that word can be misleading. Overbought does not mean the market has run out of buyers or must reverse immediately. In a strong trend, RSI can remain above 70 while price keeps making new highs.
What Does RSI Below 30 Mean?
RSI below 30 means recent losses have dominated recent gains. It is traditionally labelled “oversold.” Again, this does not guarantee that sellers are exhausted. During a strong bearish trend, RSI can remain below 30 while price continues falling.
A Better Way to Use 70/30
Treat 70 and 30 as context markers rather than automatic trade signals. A 30-to-40 RSI reading near major support in a broader uptrend is often more useful than blindly buying the first print below 30 in a collapsing market. Likewise, an RSI reading above 70 at major resistance after a long rally is more meaningful than the same reading during a fresh breakout.
The RSI 50 Line: A Simple Momentum Filter
The 50 midpoint is underused. RSI above 50 means average gains are currently stronger than average losses over the lookback; below 50 means the opposite. Some traders use sustained movement above or below 50 as a simple trend or momentum filter.
Example: if EUR/USD is making higher highs and higher lows and RSI repeatedly holds above 50 on pullbacks, the momentum structure supports the bullish price trend. If RSI repeatedly fails below 50 while price is also forming lower highs, the bearish case becomes stronger.
Best RSI Settings: 7, 14 or 21 Periods?
There is no universally best RSI setting. The 14-period setting is the standard starting point because it balances sensitivity and smoothing. Shorter settings react faster and reach extremes more often; longer settings move more slowly and can filter some noise.
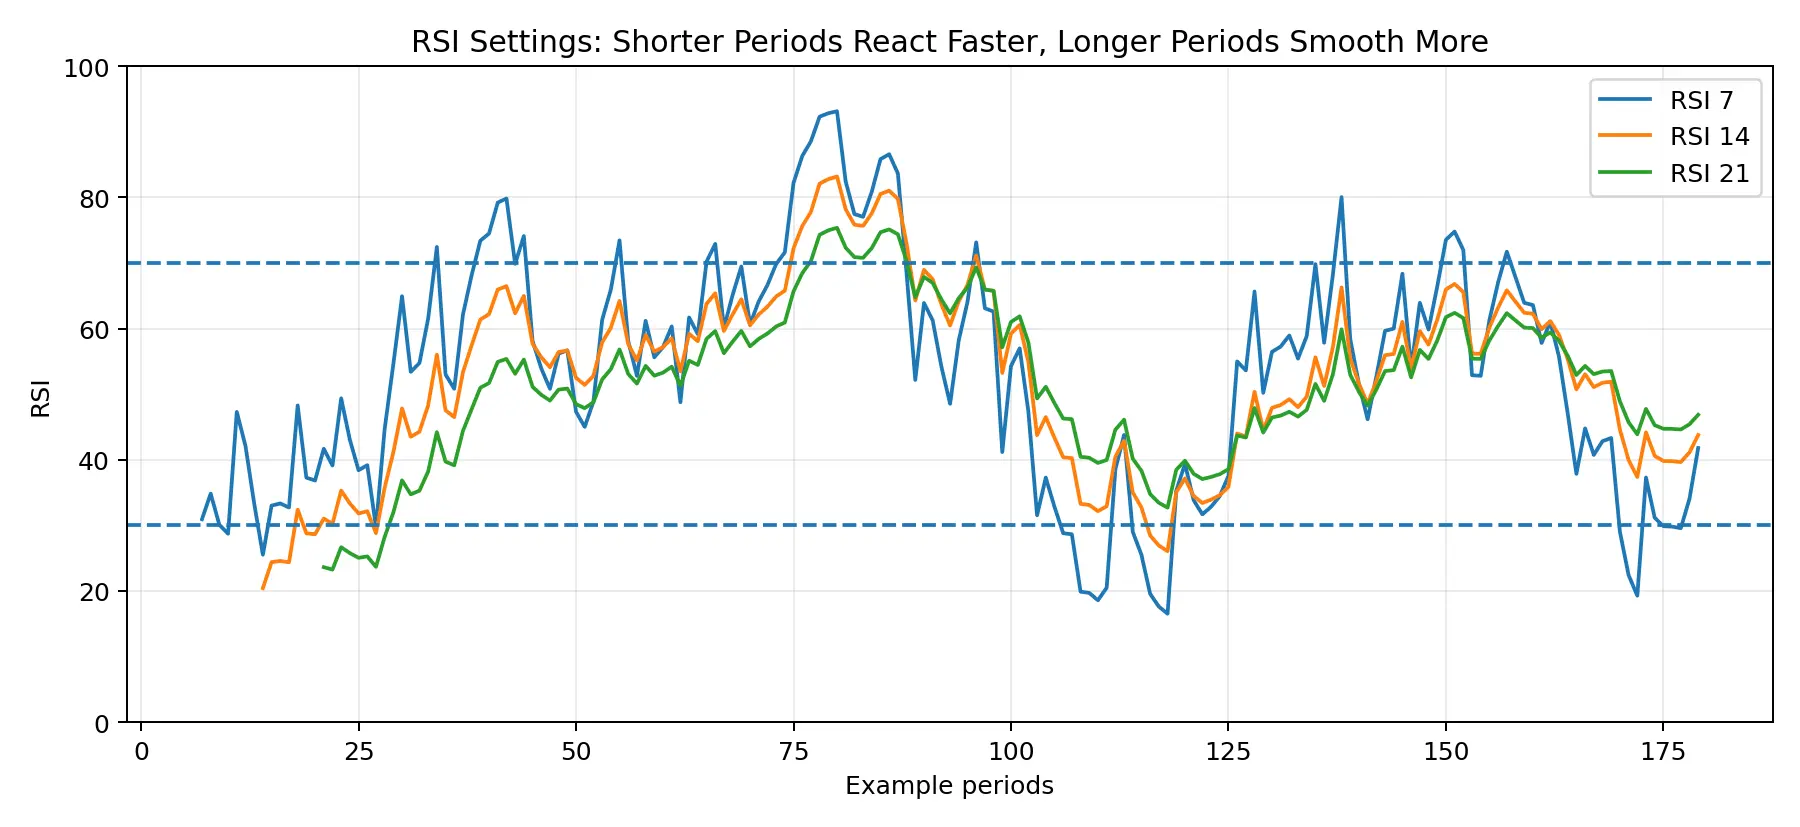
| Setting | Behaviour | Possible use | Trade-off |
|---|---|---|---|
| 7-period | Fast, more sensitive | Short-term momentum/scalping research | More false extremes and noise |
| 14-period | Balanced default | General trading and education | May still lag fast reversals |
| 21-period | Smoother, slower | Swing/position context | Fewer signals and later turns |
Do not change the period just because one setting looked better on the last chart. Test settings over a meaningful sample and keep the rest of the strategy constant so you can tell whether the change genuinely improves the process.
RSI Divergence: One of the Most Useful RSI Concepts
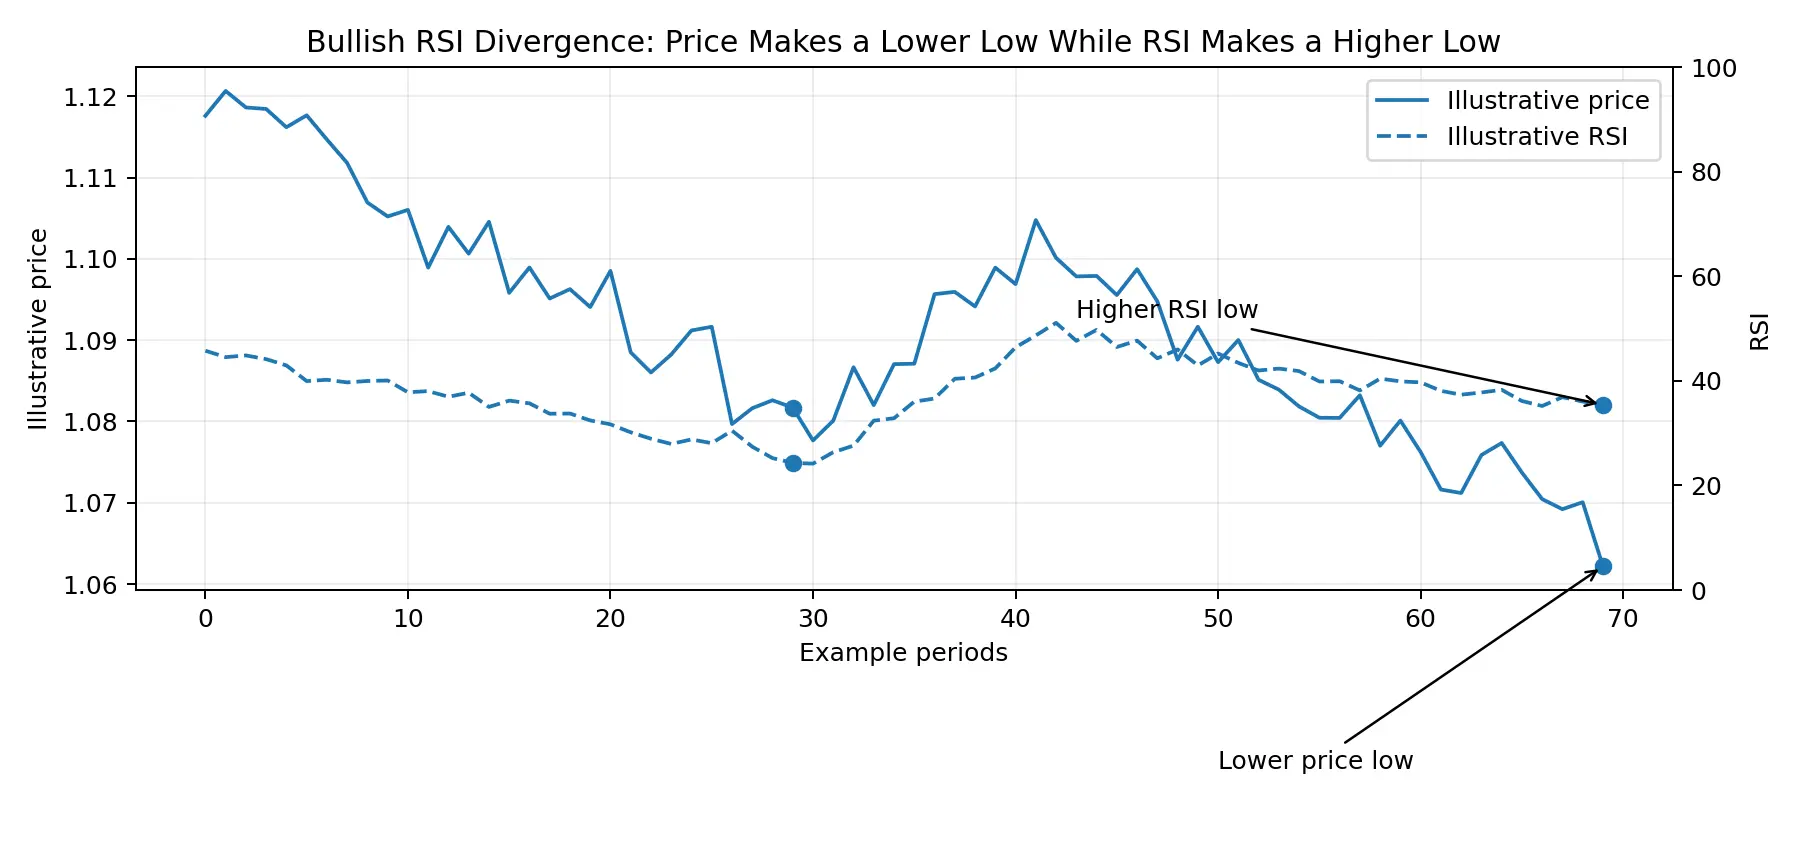
RSI divergence occurs when price and momentum do not confirm one another. The divergence suggests that the latest price extreme is being made with weaker momentum than the previous extreme. It is a warning, not a guaranteed reversal.
Bullish RSI Divergence
Regular bullish divergence occurs when price makes a lower low while RSI makes a higher low. Price is still falling, but downside momentum is weaker on the second low. Traders usually treat this as an early warning and wait for price confirmation before assuming a reversal.
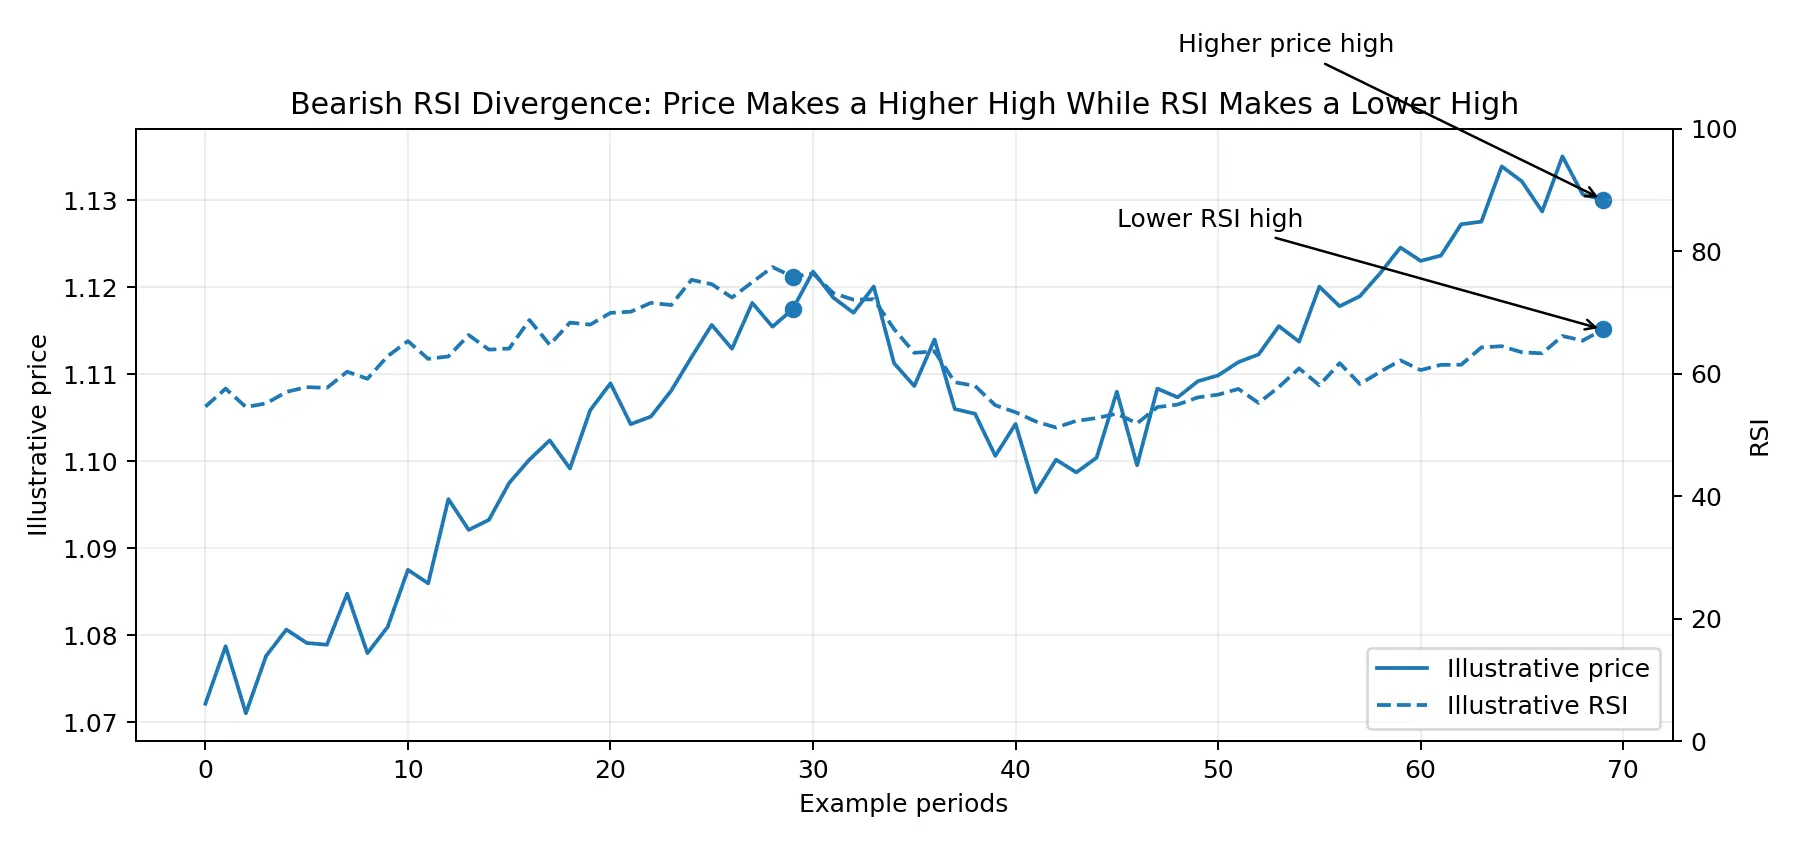
Bearish RSI Divergence
Regular bearish divergence occurs when price makes a higher high while RSI forms a lower high. Buyers have pushed price to a new high, but momentum has not confirmed the move. Traders often watch for a break of support, a lower high or another confirmation before acting.
Hidden RSI Divergence
Hidden divergence is usually interpreted as a continuation signal rather than a reversal signal. Hidden bullish divergence occurs when price forms a higher low but RSI forms a lower low. Hidden bearish divergence occurs when price forms a lower high while RSI forms a higher high. These setups are most useful when the larger trend is already clear.
How to Trade RSI Divergence More Carefully
Identify divergence at a meaningful support/resistance area rather than in the middle of a range.
Wait for price confirmation such as a break of structure, rejection candle or trendline break.
Define the invalidation level beyond the relevant swing high or low.
Avoid assuming the first divergence must reverse a strong trend; multiple divergences can form before price turns.
RSI Failure Swings
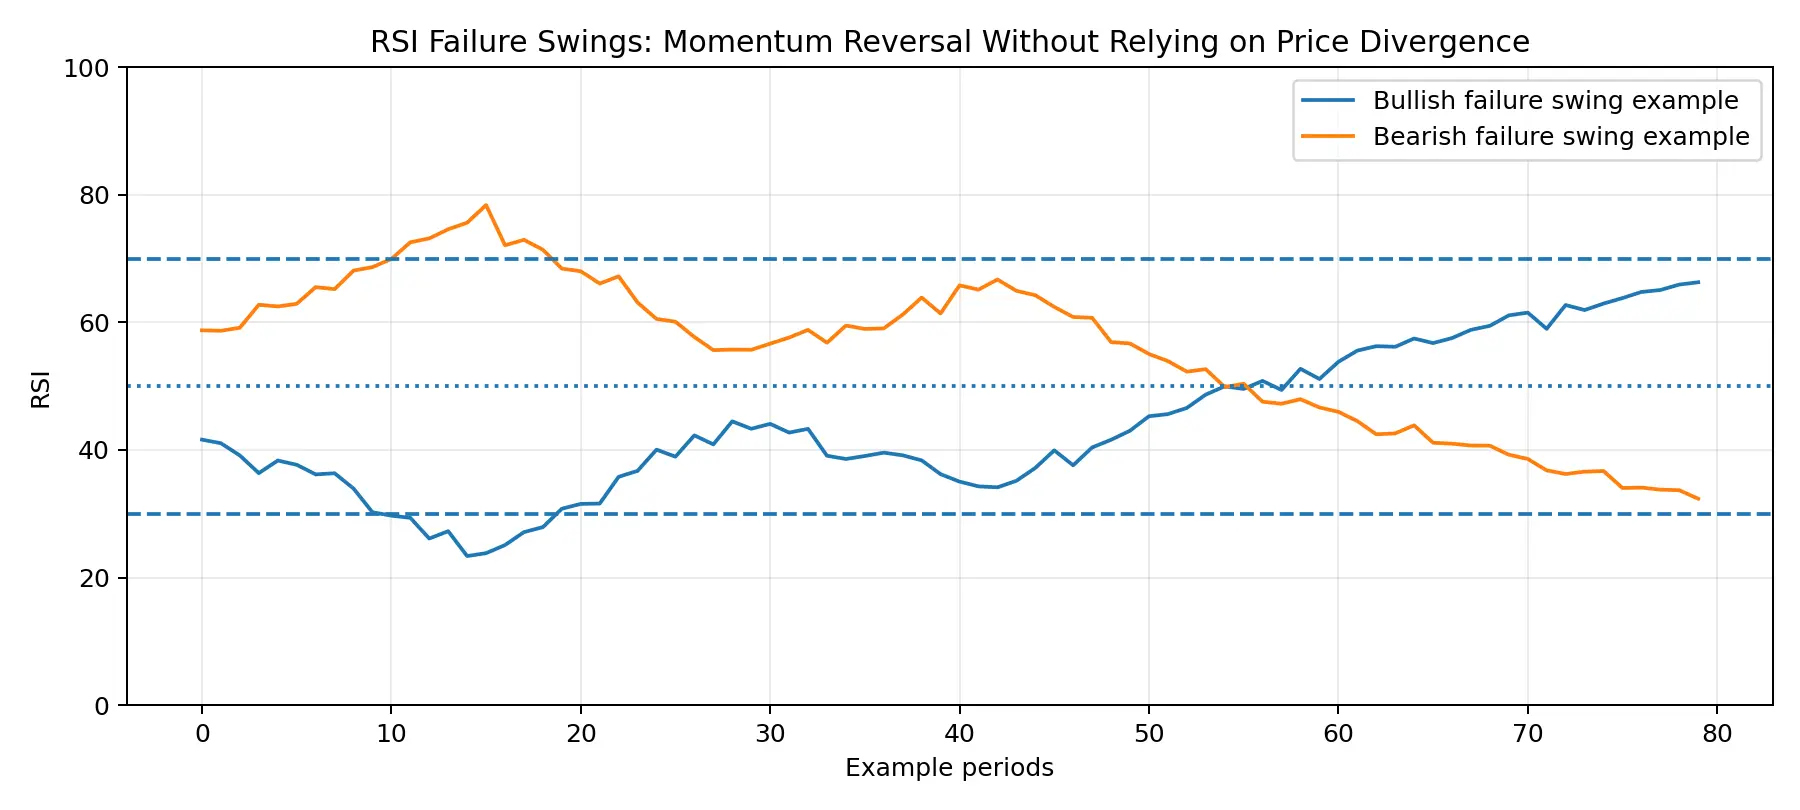
Failure swings are RSI momentum patterns that can be identified without relying on price divergence. Wilder described bullish and bearish versions. The idea is that RSI moves into an extreme, recovers, tests momentum again and then breaks a prior RSI swing level.
Bullish Failure Swing
A common bullish sequence is: RSI falls below 30, rebounds above 30, pulls back but holds above the previous extreme, then breaks above its prior RSI swing high. Traders still need price confirmation and a risk level; the RSI break alone is not enough.
Bearish Failure Swing
A bearish failure swing is the mirror image: RSI moves above 70, falls, rebounds without making a stronger extreme, then breaks below its prior RSI swing low.
Using RSI to Analyse Trend Strength
RSI can support trend analysis when its behaviour agrees with price structure. In an uptrend, the indicator often spends more time above 50 and can remain elevated during strong advances. In a downtrend, RSI often spends more time below 50 and struggles to sustain high readings.
Very long RSI settings can be used as a slow momentum filter, but they are not a standard requirement. A cleaner approach is to define the primary trend with price structure or a longer-term moving average, then use RSI as momentum confirmation.
Why RSI Works Better With Price Structure
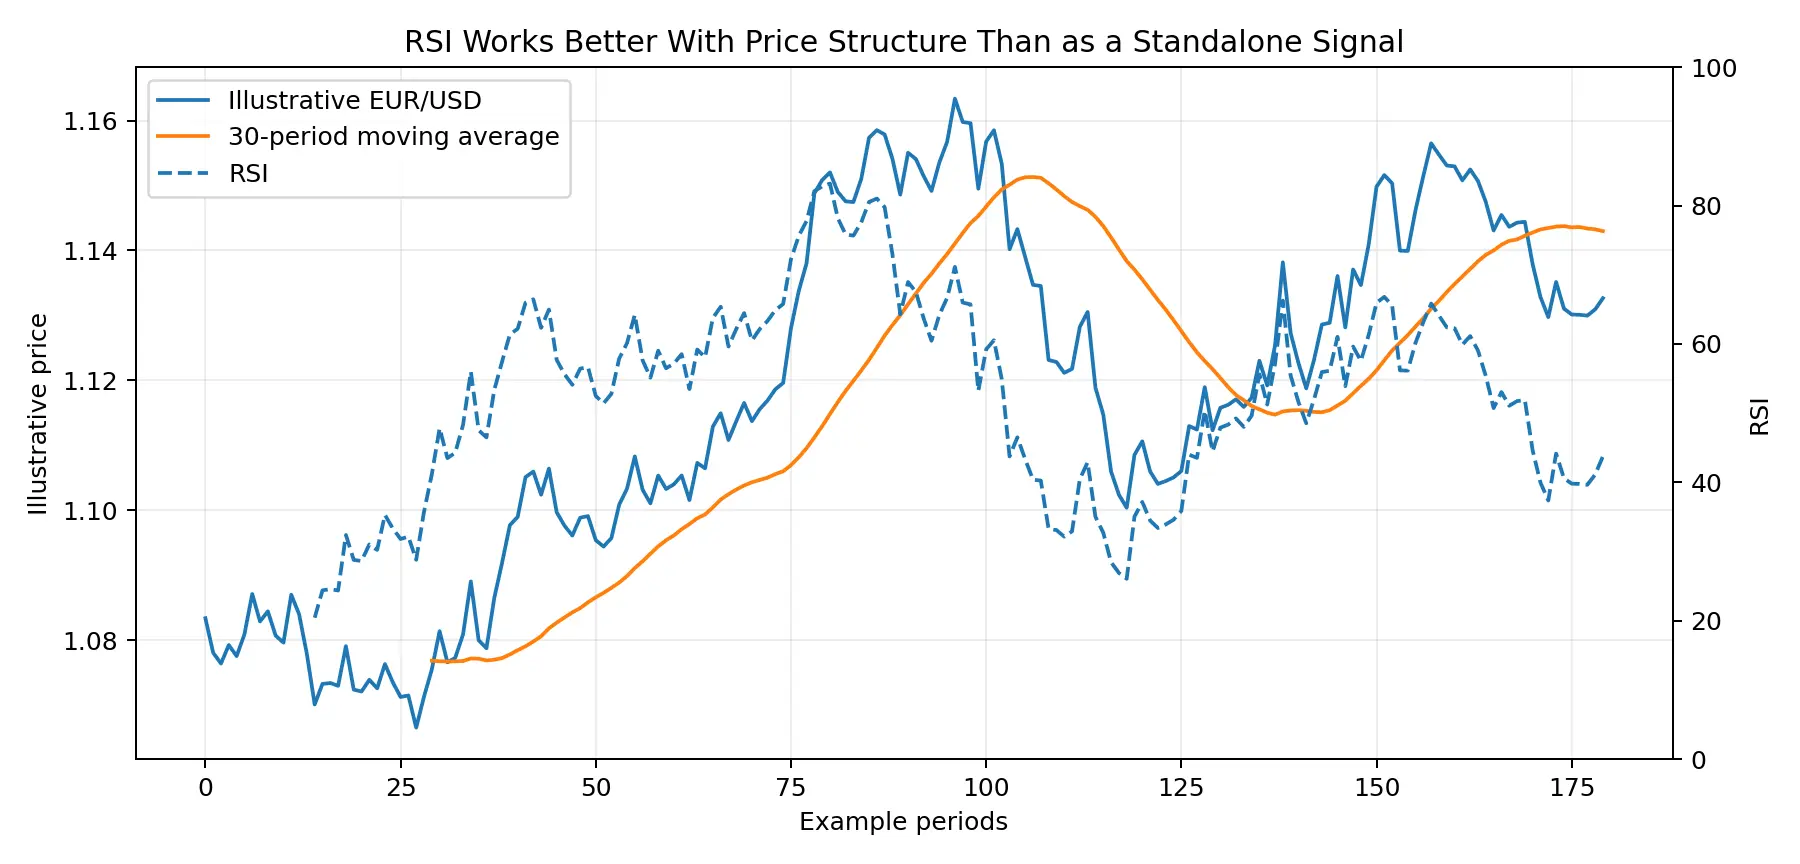
A technical indicator is strongest when it answers one question inside a larger setup. The forex market analysis guide explains how technical, fundamental and sentiment evidence fit into that broader decision process. RSI tells you about momentum. It does not tell you where institutional support sits, whether a central-bank decision is due in ten minutes, or what position size is appropriate.
Practical RSI Trading Strategies
1. Trend Pullback Strategy With the RSI 50 Line
First identify an established uptrend using price structure or a moving average. Wait for a pullback toward support while RSI falls toward the 40-50 area rather than collapsing. A bullish price reaction and RSI recovery above 50 can provide a momentum confirmation. In a downtrend, reverse the logic.
2. Range Reversal Strategy With 70/30
RSI extremes tend to be more useful in a genuine range than in a strong trend. If EUR/USD repeatedly respects support and resistance, a move below 30 near range support followed by RSI recovery can support a long setup. The stop belongs beyond the price structure, not simply because RSI moved back above 30.
3. RSI Divergence Strategy
Look for regular bullish or bearish divergence at an important swing level. Wait for price to confirm that the prior trend is losing structure. This can mean a break of a minor trendline, a failed retest or a new swing in the opposite direction. The divergence is the warning; price action is the trigger.
4. RSI + Moving Average Confluence
Use a moving average to define trend context and RSI to measure momentum. The forex trading tools guide covers charting platforms, calculators and supporting resources that can help build this workflow. For example, when price is above a rising 50-period average, a pullback that keeps RSI above a deeply oversold reading and then turns higher can be more attractive than blindly buying every RSI below 30.
5. RSI + MACD Confirmation
RSI and MACD both measure momentum, so they are not fully independent signals. Still, the combination can be useful when the indicators agree with price structure. For example, bullish divergence on RSI plus a MACD histogram improvement after a support rejection can strengthen a reversal thesis. Avoid counting the two indicators as separate “votes” if they are both responding to the same short-term move.
6. RSI + Bollinger Bands
A common approach is to look for RSI momentum extremes when price is also testing an outer Bollinger Band. The better setup usually depends on regime: in a range, an outer-band rejection plus RSI recovery can support mean reversion; in a strong trend, price may ride the outer band while RSI remains stretched, making counter-trend entries dangerous.
7. RSI + Fibonacci Retracement
Fibonacci levels can provide a price zone while RSI provides momentum context. If a 50% or 61.8% retracement aligns with prior support and RSI turns higher from a neutral-to-weak reading, the confluence can support a continuation setup. The Fibonacci ratio itself does not validate the trade.
RSI on Different Timeframes
| Trading style | Typical RSI use | Main risk |
|---|---|---|
| Scalping | Shorter-period RSI on low timeframes, always with spread/news awareness | High noise and frequent false extremes |
| Day trading | 14-period RSI on 5m-1H with higher-timeframe context | Economic releases can overwhelm indicator signals |
| Swing trading | 14-21 period RSI on 1H-4H/daily charts | Signals develop slowly; overnight risk matters |
| Position trading | Longer RSI settings on daily/weekly charts as momentum context | Indicator can lag major macro regime changes |
The timeframe should match the intended holding period. A one-minute RSI reversal is not a meaningful reason to exit a position trade built from the weekly chart.
RSI vs Stochastic: What Is the Difference?
RSI compares average gains with average losses, while the Stochastic Oscillator compares the current close with the recent high-low range. Both are momentum oscillators, but they answer slightly different questions.
| Feature | RSI | Stochastic |
|---|---|---|
| Typical scale | 0-100 | 0-100 |
| Common extreme zones | 70 / 30 | 80 / 20 |
| Core calculation | Average gains vs average losses | Close relative to recent high-low range |
| Often useful for | Momentum, trend regime, divergence | Range momentum, crossovers, pullback timing |
| Main weakness | Can remain extreme in strong trends | Can produce frequent signals/noise |
Stochastic RSI is a separate indicator that applies the Stochastic formula to RSI values rather than directly to price. For the full formula, 80/20 zones, %K/%D crossovers and divergence examples, see our Stochastic RSI guide.
Williams %R is another range-position oscillator; see the Williams %R guide for its -20/-80 levels, midpoint and pullback strategies.
Limitations of RSI
RSI can stay overbought or oversold
Extreme readings can persist for a long time during powerful trends.
Divergence can be early
Momentum can diverge while price continues to make new extremes before finally reversing.
Short settings can be noisy
A very sensitive RSI reaches 70/30 often and can create more false signals.
Long settings can be slow
Smoother RSI settings can confirm a move after much of it has already happened.
The indicator does not know event risk
A technically strong RSI setup can fail instantly after a central-bank surprise or inflation release.
RSI is derived from price
It does not provide independent fundamental information or guarantee a market edge.
Indicator combinations can double-count information
RSI, Stochastic and MACD all depend on price and momentum, so stacking them does not create three independent confirmations.
How to Use RSI in Forex Trading: Step by Step
Identify the higher-timeframe trend or range before looking at RSI.
Mark major support, resistance and recent swing highs/lows.
Start with the standard 14-period RSI unless your strategy has been tested with another setting.
Use 70/30 as reference zones and 50 as a momentum midpoint, not automatic trade commands.
Look for confluence: price structure, divergence, moving-average context or another independent factor.
Check the economic calendar and the forex fundamental analysis guide for high-impact events that can override technical signals.
Define the price level that invalidates the trade before entering.
Calculate position size from the potential loss at the stop.
Record the RSI condition and screenshot in a trading journal.
Review whether RSI improved the decision over a meaningful sample rather than one or two trades.
Common RSI Mistakes Beginners Make
Buying every RSI reading below 30.
Selling every RSI reading above 70.
Ignoring the 50 midpoint and overall trend.
Calling any difference between price and RSI a valid divergence.
Using RSI divergence without price confirmation.
Changing RSI settings until the indicator fits the last chart.
Combining several momentum indicators and treating them as independent signals.
Using RSI without a stop, position-size plan or awareness of scheduled news.
Frequently Asked Questions
What is the RSI indicator?
RSI is a 0-100 momentum oscillator that compares recent average gains with recent average losses to show the strength and speed of price movement.
What is a good RSI setting for forex?
The 14-period RSI is the standard starting point. Shorter settings react faster and create more signals; longer settings are smoother. The best setting depends on timeframe and strategy and should be tested.
Is RSI above 70 a sell signal?
No. RSI above 70 means momentum is strong and traditionally overbought, but strong trends can remain above 70. Price structure and trend context should decide whether a short setup exists.
Is RSI below 30 a buy signal?
No. RSI below 30 means momentum is weak and traditionally oversold. Price can continue falling for a long time. A recovery at support or another confirmation is more useful than the threshold alone.
What does RSI 50 mean?
The 50 midpoint means average gains and losses are balanced over the RSI lookback. Sustained movement above 50 can support bullish momentum; below 50 can support bearish momentum.
What is RSI divergence?
RSI divergence occurs when price and RSI do not confirm each other. Regular bullish divergence is a lower low in price and higher low in RSI; regular bearish divergence is a higher high in price and lower high in RSI.
Does RSI divergence always work?
No. Divergence can appear early and price can continue trending. Traders often wait for a price-structure break or other confirmation before acting.
Which is better: RSI or Stochastic?
Neither is universally better. RSI measures average gains versus losses; Stochastic measures the close relative to the recent range. Their usefulness depends on market regime and strategy.
Can RSI be used for scalping?
Yes, but low timeframes are noisy. Short RSI settings can create frequent false signals, and spreads/news can dominate a small scalping setup.
Can RSI predict reversals?
RSI can highlight weakening momentum or stretched conditions, but it cannot predict reversals with certainty. It should be combined with price structure and risk management.
Bottom Line
RSI is most valuable when it is treated as a momentum tool rather than a mechanical buy/sell signal. The 70/30 levels identify stretched momentum, the 50 line helps with regime context, divergence can warn that a trend is losing force, and failure swings can highlight momentum reversals.
The strongest RSI setups combine the indicator with price structure, trend direction, support/resistance and a defined invalidation level. The AAFX.io Forex Technical Analysis pillar provides the wider framework, while this page gives RSI the depth it deserves.
AAFX.io, built around Arslan Ali Butt’s market-analysis and trading education, encourages traders to test RSI rules over a meaningful sample and keep risk management separate from the indicator itself.
Continue Learning on AAFX.io
RSI is one part of a wider technical-analysis process. Continue with these published AAFX.io guides:
Forex Technical Analysis — the central pillar for trends, charts, indicators and multi-timeframe analysis.
Forex Market Analysis — combine technical, fundamental and sentiment evidence.
Forex Trading Tools — charting platforms, calendars, calculators and supporting resources.
Forex Trading for Beginners — build the wider foundation around markets, orders and risk.
Risk Warning
Forex and leveraged derivatives involve substantial risk. RSI can generate false or early signals, and news, gaps, spreads and slippage can invalidate technical setups. This article is educational and is not personalised financial advice.
Sources & Methodology
Primary-source standard: Market-moving facts should link to original data releases, regulator notices, company filings or official project announcements whenever available. Secondary reporting is used for additional context, not as a substitute for original evidence.
Page last reviewed: