Quick Answer
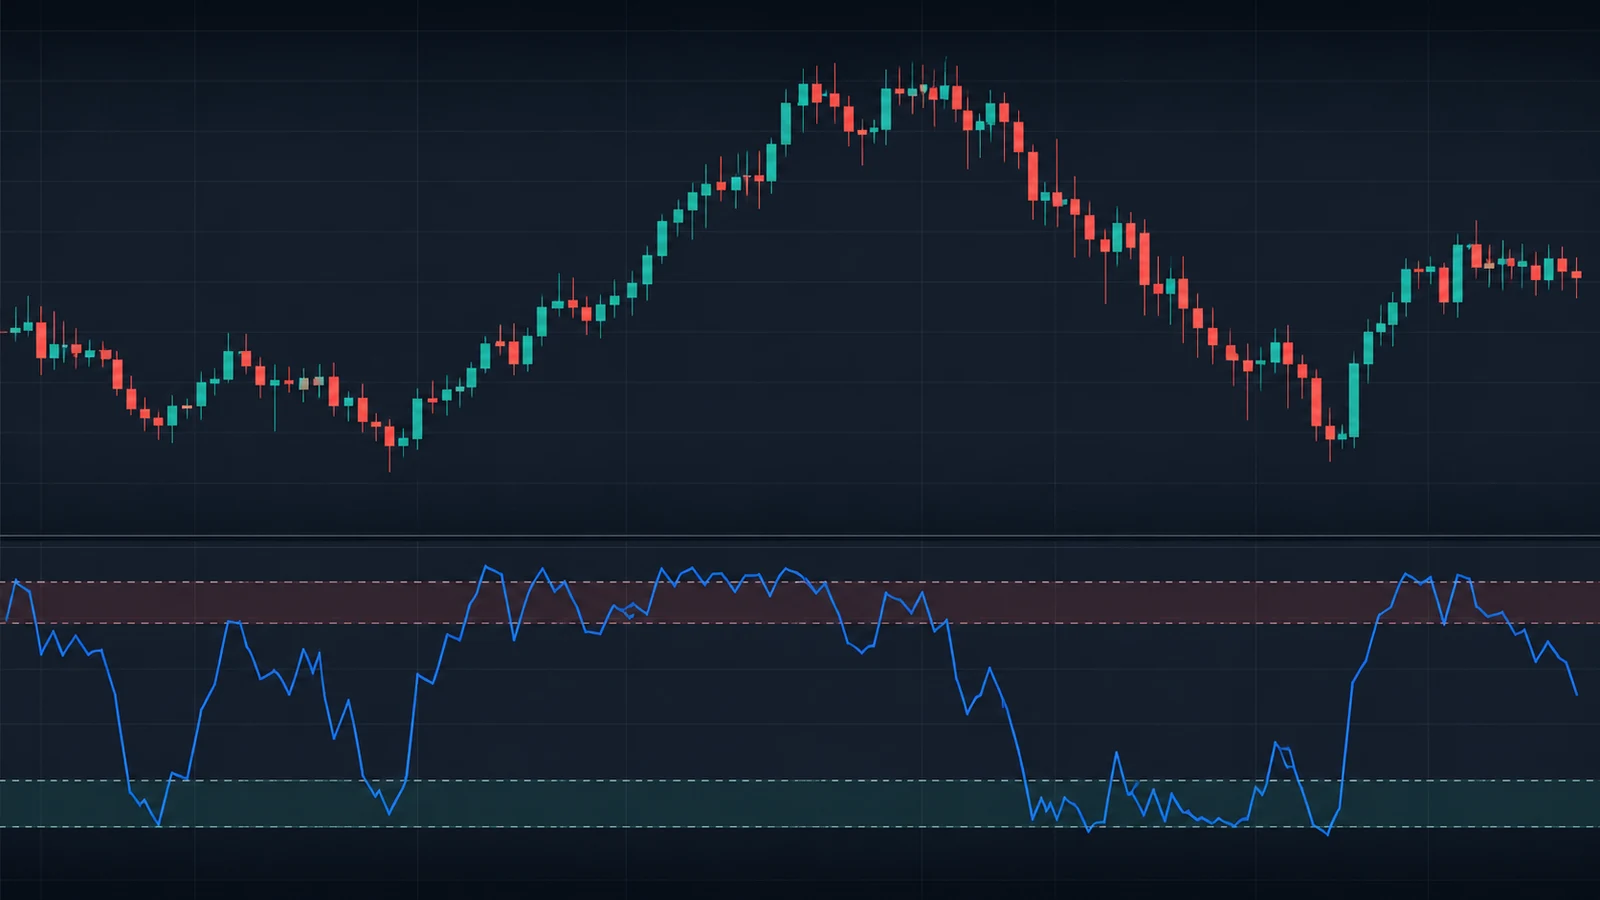
Williams %R, also called Williams Percent Range, is a momentum oscillator created by Larry Williams. It measures where the current closing price sits within the recent high-low range over a chosen lookback period, usually 14 periods. The indicator moves from 0 at the top to -100 at the bottom, with readings above -20 commonly treated as overbought and readings below -80 treated as oversold. Traders use Williams %R to spot momentum extremes, reversals, pullback entries and divergence, but it works best when combined with trend direction, price structure and risk management rather than traded in isolation.
What Is the Williams %R Indicator?
Williams %R is one of those indicators that can look simple at first glance and slightly suspiciously simple the longer you stare at it. It has only one line. It usually uses one default period. And it seems to say, “price is near the top of the recent range” or “price is near the bottom.” That simplicity is exactly why it remains useful.
Created by Larry Williams, the indicator was designed to show overbought and oversold conditions. In practical trading, though, it can do more than that. It can help you judge momentum, time entries during pullbacks, confirm range trades and notice divergence when price and momentum stop agreeing.
How Williams %R Works
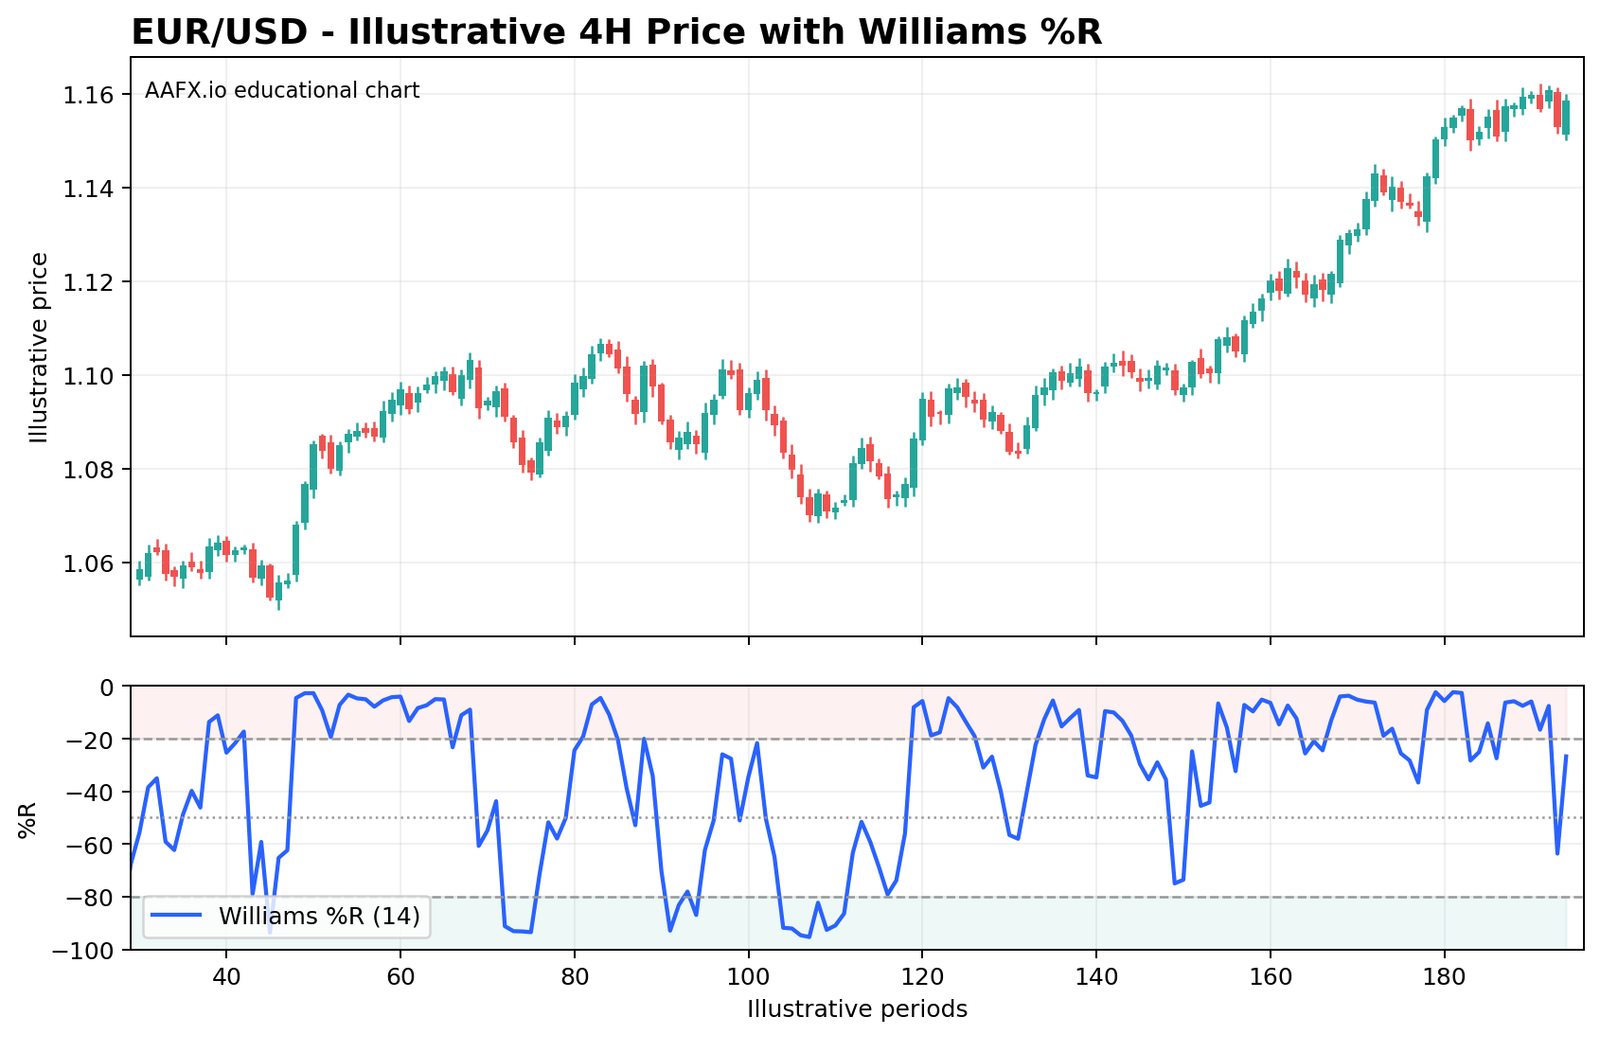
The logic is straightforward. If the current close is very near the highest high of the last 14 candles, Williams %R will be near 0. If the close is very near the lowest low of the last 14 candles, the indicator will be near -100. In other words, the indicator tells you where price is sitting inside its recent range.
That is why Williams %R is often described as a range-position oscillator. It is not measuring trend directly, and it is not forecasting future price on its own. It is telling you how strong or weak the latest close is relative to the recent price window.
Williams %R Formula
Williams %R is calculated with the following expression:
%R = [(Highest High – Current Close) / (Highest High – Lowest Low)] × -100
The “Highest High” and “Lowest Low” are taken from the chosen lookback period, typically 14 bars. Because the formula is multiplied by negative 100, the indicator moves from 0 to -100 rather than from 0 to 100.
A value close to 0 means the close is near the recent high. A value close to -100 means the close is near the recent low. That makes it easy to understand why traders use the indicator to judge whether momentum is stretched.
How to Add Williams %R to MT4 or TradingView
- Open the chart for the forex pair, commodity or index you want to analyse.
- Click “Indicators” and search for “Williams %R” or “Williams Percent Range.”
- Select the built-in indicator rather than a custom script while you are learning the standard version.
- Keep the default 14-period lookback at first.
- Add horizontal reference levels at -20, -50 and -80 if your platform does not show them automatically.
- Leave enough space to view price action and the indicator together. The line means much more when it is read alongside support, resistance and trend structure.
On MT4 and MT5, Williams %R is included by default. On TradingView, it can be added from the Indicators menu just as easily. The main point is not the platform. The main point is keeping the price chart visible so you do not trade the oscillator in a vacuum.
Reading Williams %R: Overbought, Oversold and the Midpoint
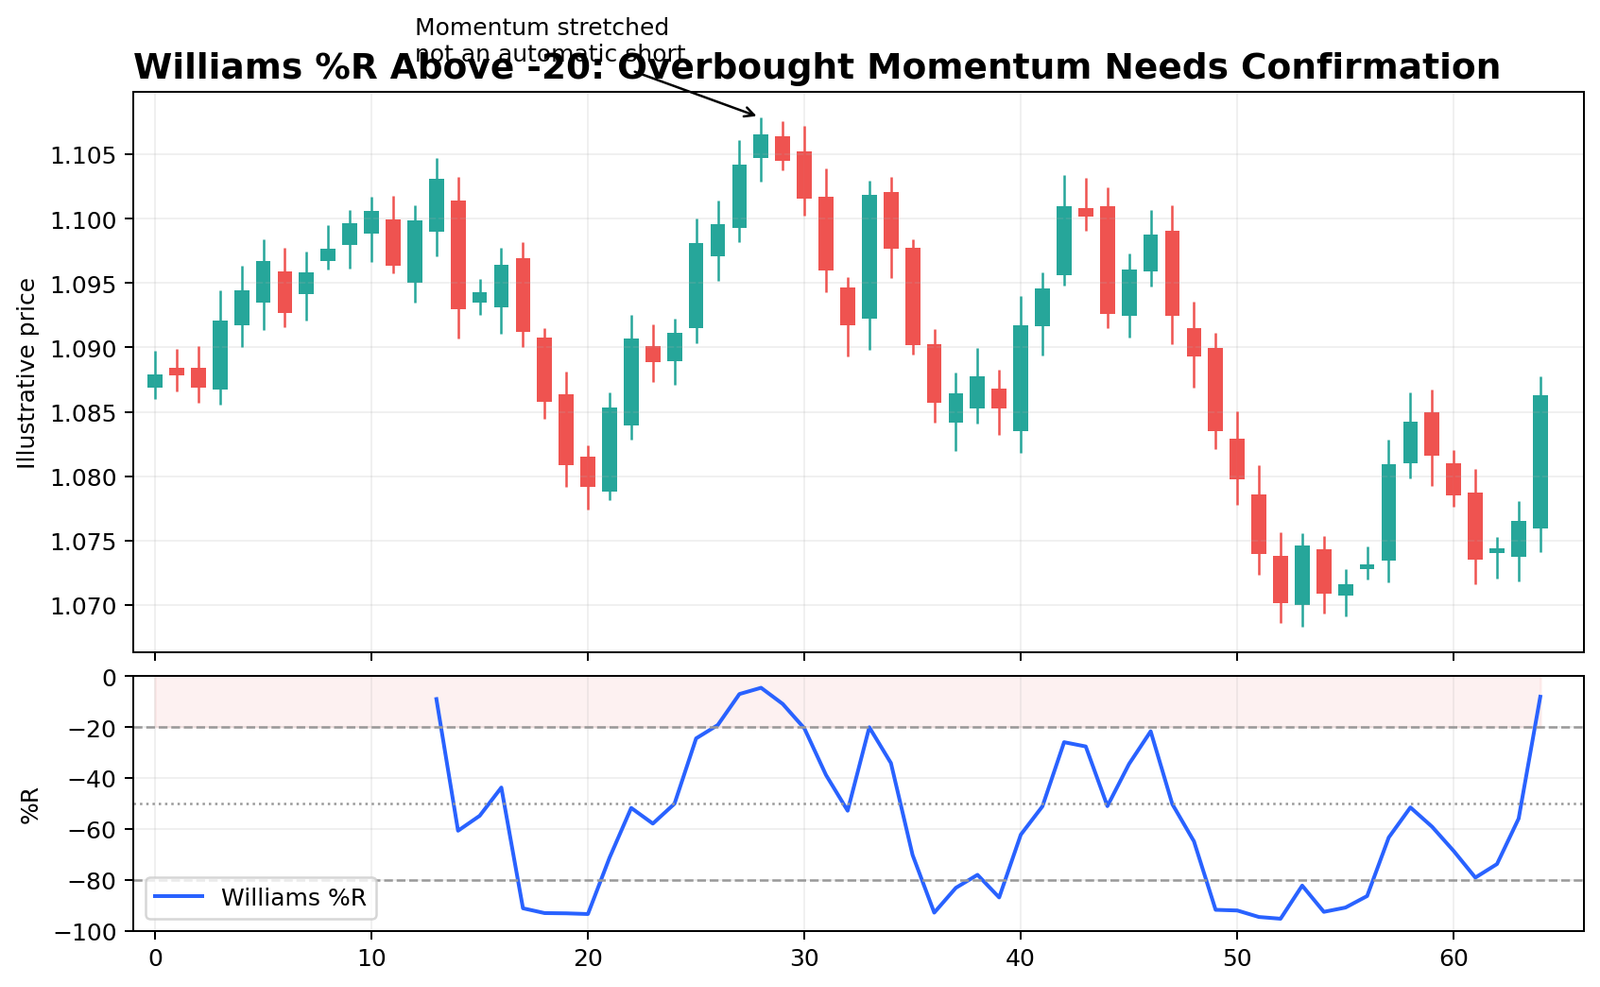
Above -20: Overbought
When Williams %R rises above -20, price is closing near the top of its recent range. That is commonly called overbought. The trap is assuming overbought means “sell now.” In a strong uptrend, price can stay strong and the indicator can hover near the top for longer than impatient traders would like.
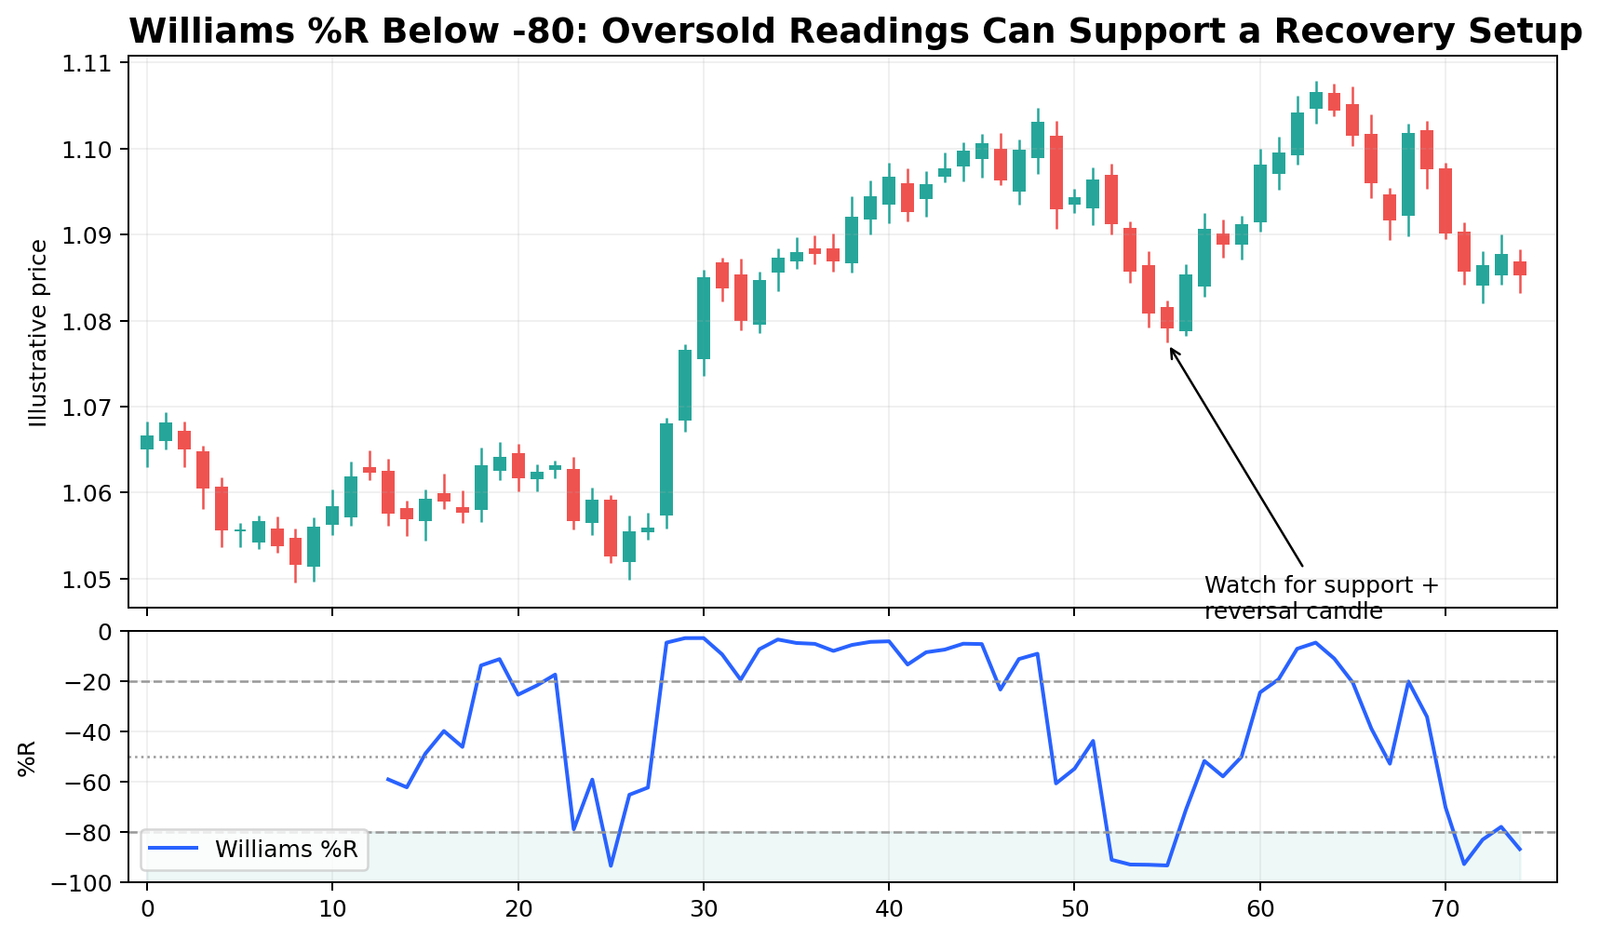
Below -80: Oversold
When Williams %R drops below -80, price is closing near the bottom of its recent range. This is commonly treated as oversold. Again, oversold does not mean “buy immediately.” A falling market can remain weak. The best signals usually appear when oversold readings line up with support or a broader uptrend pullback.
The Midpoint at -50
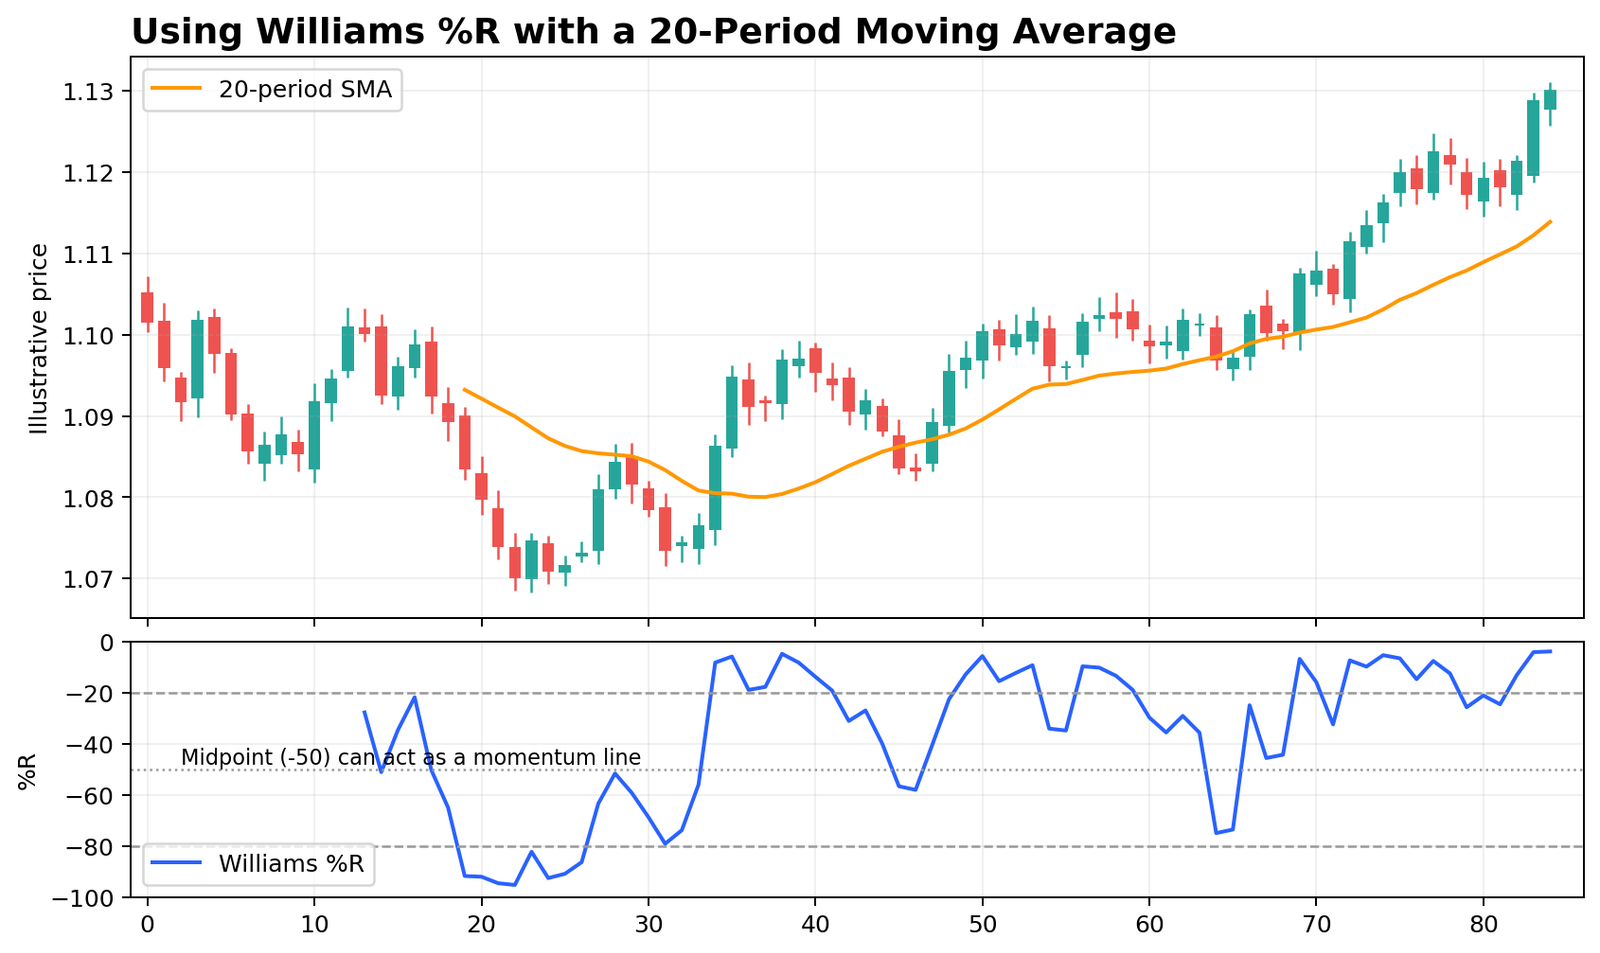
The midpoint at -50 is less famous than the -20 and -80 zones, but it is surprisingly helpful. Above -50, the close is in the upper half of the recent range. Below -50, it is in the lower half. Some traders use the midpoint as a momentum filter: if price is trending up and Williams %R reclaims -50 after a pullback, it can suggest momentum is stabilising again.
Williams %R vs RSI
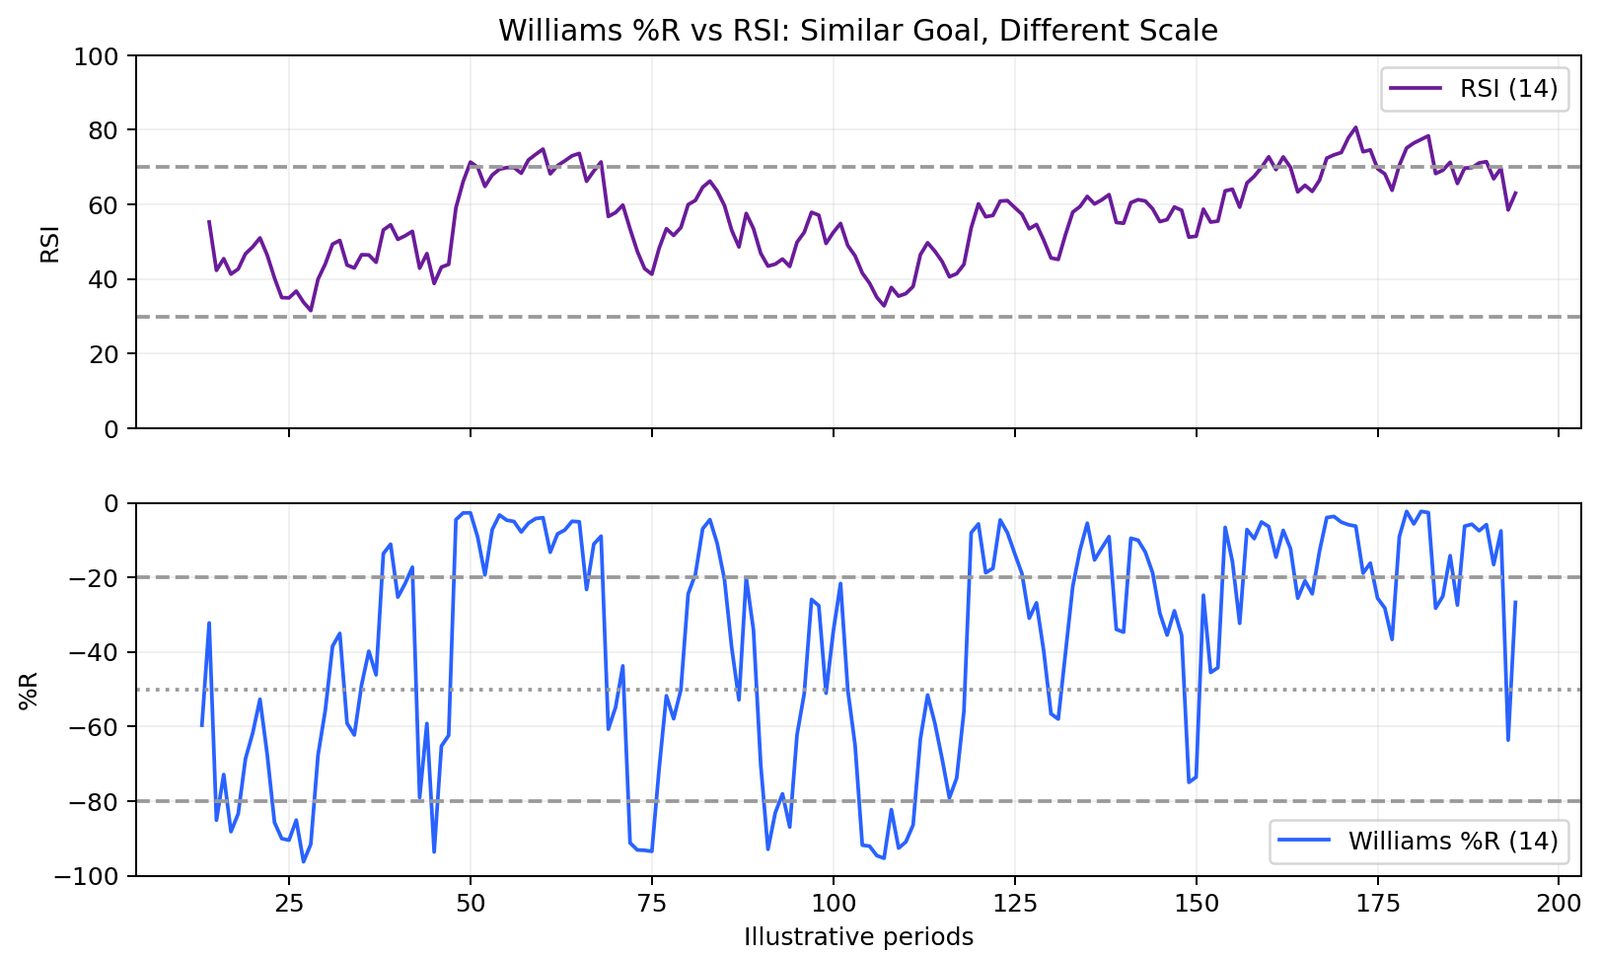
Williams %R and the Relative Strength Index often point to similar conditions, but they are calculated differently. RSI compares average gains with average losses. Williams %R compares the current close with the recent high-low range. They may both help identify overbought and oversold areas, but they will not always turn at the same moment.
| Indicator | Formula basis | Typical zones | Best use |
|---|---|---|---|
| Williams %R | Close relative to recent range | -20 / -80 / -50 | Range position, pullbacks, reversals |
| RSI | Average gains vs losses | 70 / 30 / 50 | Broader momentum, trend context, divergence |
Neither indicator is universally better. Williams %R can be very intuitive for traders who like seeing whether price is near the top or bottom of its range. RSI can be smoother and more comfortable for judging broader momentum. Many traders combine the two, but they should not be treated as two completely independent confirmations because both are momentum tools.
Williams %R Trading Strategies
1. Range Reversal Strategy
If price is moving sideways between clear support and resistance, Williams %R can be a practical timing tool. A reading below -80 near support can highlight oversold conditions, while a reading above -20 near resistance can flag stretched upside momentum. The price level matters more than the oscillator. The indicator helps with timing; the range defines the trade.
2. Trend Pullback Strategy
In an uptrend, wait for a pullback toward support while Williams %R moves below -80. If price stabilises and the indicator turns back higher, the pullback may be ending. In a downtrend, the reverse logic applies. The point is to use Williams %R as a pullback-timing tool rather than a stand-alone reversal button.
3. Midpoint Recovery Strategy
Some traders use the move back above -50 as a sign that upside momentum is recovering after a temporary dip. This can be useful when price is already above a rising moving average. If you are more trend-focused than reversal-focused, this method can feel cleaner than trying to buy the exact oversold tick.
4. Williams %R + Moving Average
A moving average can work as a simple trend filter. If price is above a rising 20-period or 50-period average, oversold Williams %R readings may be treated as pullbacks rather than bearish breakdowns. If price is below a falling moving average, overbought readings may be treated as rallies inside a downtrend.
5. Breakout Follow-Through Strategy
Williams %R is not only for reversals. After a breakout, a quick reset from overbought back toward the midpoint and then another push higher can confirm that the move is still strong. In other words, sometimes you want the indicator to cool down a bit, not collapse.
Williams %R Divergence
Divergence appears when price makes a new high or low that Williams %R does not confirm. A bullish divergence occurs when price makes a lower low but the indicator makes a higher low. A bearish divergence occurs when price makes a higher high but the indicator makes a lower high.
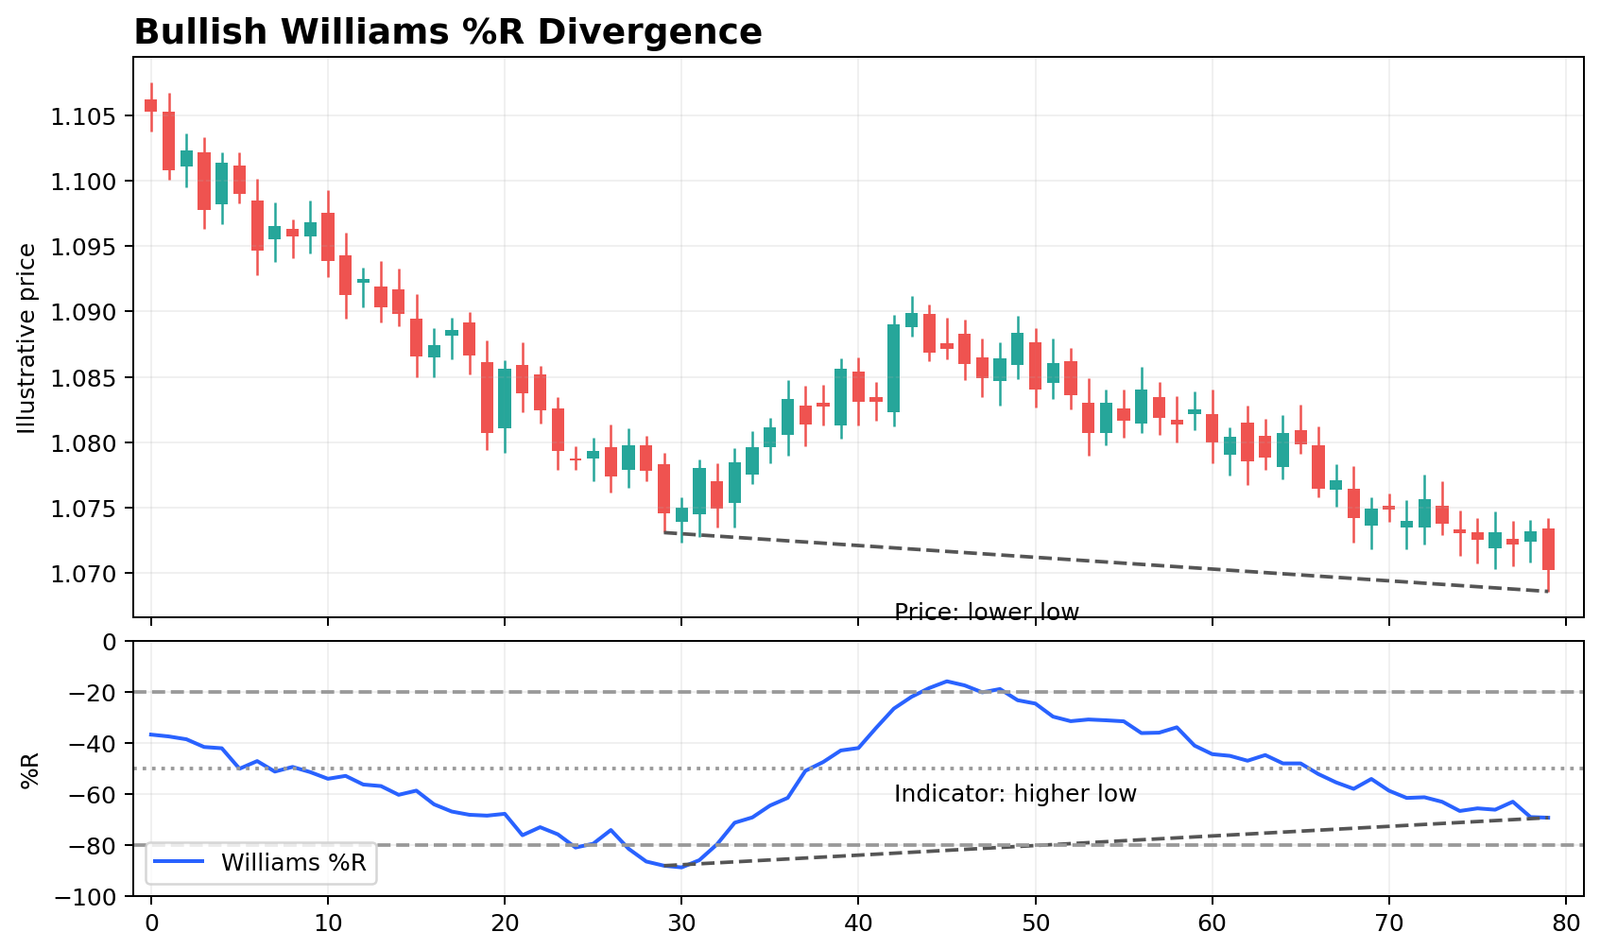
Divergence is best treated as an early warning, not as a final instruction. Markets can continue trending even after divergence appears. The safer approach is to let price confirm the idea with a break of structure, a rejection candle or a failed retest.
Best Williams %R Settings
The standard 14-period setting is popular for a reason. It balances responsiveness and stability. Shorter settings will react faster and generate more signals, but they also generate more noise. Longer settings may reduce noise but can delay entries.
| Setting type | Example | Behaviour | Risk |
|---|---|---|---|
| Standard | 14 periods | Balanced for many forex pairs | Still noisy in choppy markets |
| Faster | 7–10 periods | Earlier turns, more frequent signals | Higher whipsaw risk |
| Slower | 20+ periods | Cleaner, fewer signals | Signals may arrive late |
The right setting depends on your timeframe and strategy. A scalper on a five-minute chart may prefer a different feel from a swing trader watching four-hour setups. Just do not fall into the classic trap of overfitting a setting to the last attractive chart.
Common Mistakes When Using Williams %R
- Buying every time the indicator goes below -80 and selling every time it rises above -20.
- Ignoring trend direction and support/resistance.
- Treating divergence as a guaranteed reversal.
- Using the indicator without a price-based stop-loss plan.
- Assuming one setting is “the best” for every market and timeframe.
- Stacking multiple momentum indicators and thinking that three similar signals equal three separate edges.
- Forgetting that major news can overpower a clean technical setup.
A Simple Williams %R Workflow for Beginners
- Identify whether the market is trending or ranging.
- Mark support, resistance and the price level that would invalidate your trade idea.
- Add Williams %R with the standard 14-period setting.
- Check whether the indicator is near -20, -50 or -80.
- Use the indicator to support the price idea instead of replacing it.
- Wait for confirmation from price action or trend structure.
- Place the stop according to price invalidation, not according to the oscillator line.
- Calculate position size before entering the trade.
- Check the economic calendar for nearby high-impact events.
- Journal the result to see whether Williams %R actually improves your strategy.
Frequently Asked Questions
What is Williams %R?
Williams %R is a momentum oscillator that shows where the current close sits within the recent high-low range.
Who created Williams %R?
The indicator was created by Larry Williams.
What do -20 and -80 mean in Williams %R?
Readings above -20 are commonly considered overbought, and readings below -80 are commonly considered oversold.
Is Williams %R better than RSI?
Not universally. Williams %R can be very intuitive for range position and pullback timing, while RSI can be smoother for broader momentum analysis.
What is the best Williams %R setting?
Fourteen periods is the most common default. Faster or slower settings can be used, but they should be tested.
Can Williams %R be used for forex trading?
Yes. It is commonly used in forex, especially for range reversals, pullback timing and divergence analysis.
How do you use Williams %R with a moving average?
A moving average can define trend direction while Williams %R helps time pullbacks or momentum recoveries inside that trend.
Can Williams %R stay overbought or oversold for a long time?
Yes. In strong trends, the indicator can remain near its extremes for extended periods, which is why extremes alone should not be traded blindly.
What is bullish divergence in Williams %R?
Bullish divergence happens when price makes a lower low but Williams %R forms a higher low, which may indicate weakening downside momentum.
Bottom Line
Williams %R remains useful because it answers a simple question very clearly: is the current close near the top or the bottom of the recent range? That can help traders spot stretched momentum, time pullbacks and recognise potential reversals without cluttering the chart with too many tools.
Its biggest weakness is also its biggest temptation. Because the line is easy to read, traders often trust it too quickly. Overbought and oversold are not commands. They are context clues. The strongest setups appear when Williams %R agrees with price structure, trend direction and a sensible risk plan.
As part of the AAFX.io technical analysis library, this guide works best alongside the broader Forex Technical Analysis pillar, the RSI guide, the Stochastic RSI guide and the Support & Resistance guide. Each article covers a different piece of the same puzzle: building trade ideas that are structured, testable and easy to explain.
Risk warning: Forex and leveraged products involve substantial risk. Indicators can generate false or early signals, and news, spreads and slippage can invalidate technically clean setups. This article is educational and not personalised financial advice.
Sources & Methodology
Primary-source standard: Market-moving facts should link to original data releases, regulator notices, company filings or official project announcements whenever available. Secondary reporting is used for additional context, not as a substitute for original evidence.
Page last reviewed: