Quick Answer
Forex technical analysis is the study of price behaviour to identify trends, support and resistance, momentum, volatility and possible trade setups. A complete technical process starts with the chart and market structure, then adds tools such as moving averages, pivot points, RSI, MACD, ADX, ATR, Bollinger Bands, Fibonacci, oscillators and chart patterns only when they answer a specific question. Technical analysis cannot predict the future with certainty. Its real value is in creating a repeatable decision framework: where a setup becomes interesting, what would invalidate it, how volatile the market is, and whether the potential reward justifies the risk.
Technical analysis is one part of a complete market process. New traders can begin with the Forex Trading for Beginners guide, then use this pillar alongside Forex Market Analysis and Forex Fundamental Analysis to combine chart structure with the economic forces moving a currency pair.
1. Introduction
Overview of Technical Analysis
Technical analysis studies market price data and chart behaviour rather than trying to estimate the intrinsic value of a currency. In forex, the analyst looks for recurring structures such as trends, ranges, breakouts, momentum shifts and reactions around important price zones. The chart is treated as a record of how buyers and sellers have responded to information.
Importance of Technical Analysis in Forex Trading
Forex trades around the clock during the business week and reacts continuously to macro data, central banks, institutional flows and risk sentiment. Technical analysis helps traders organise that movement into usable levels and scenarios. It is especially valuable for timing: fundamentals may suggest that the U.S. dollar should weaken, but the chart can help decide whether EUR/USD is actually breaking resistance or still trapped in a range.
Objectives of This Guide
Teach beginners how to read charts before relying on indicators.
Explain the major trend, momentum, volatility and oscillator tools used in forex.
Show practical examples of entries, exits, invalidation and multi-timeframe analysis.
Explain the limitations of each tool so indicators are not treated as automatic signals.
Act as the Arslan Ali Markets technical-analysis hub, with separate articles available for deeper study of individual indicators and patterns.
If you are still choosing software, the Forex Trading Platforms guide explains how MT4, MT5, cTrader and TradingView differ. The Forex Trading Tools and Resources guide covers the wider toolkit, including calendars, alerts, position-size calculators, backtesting and journals.
2. Understanding Trends
Definition of a Trend in Forex Trading
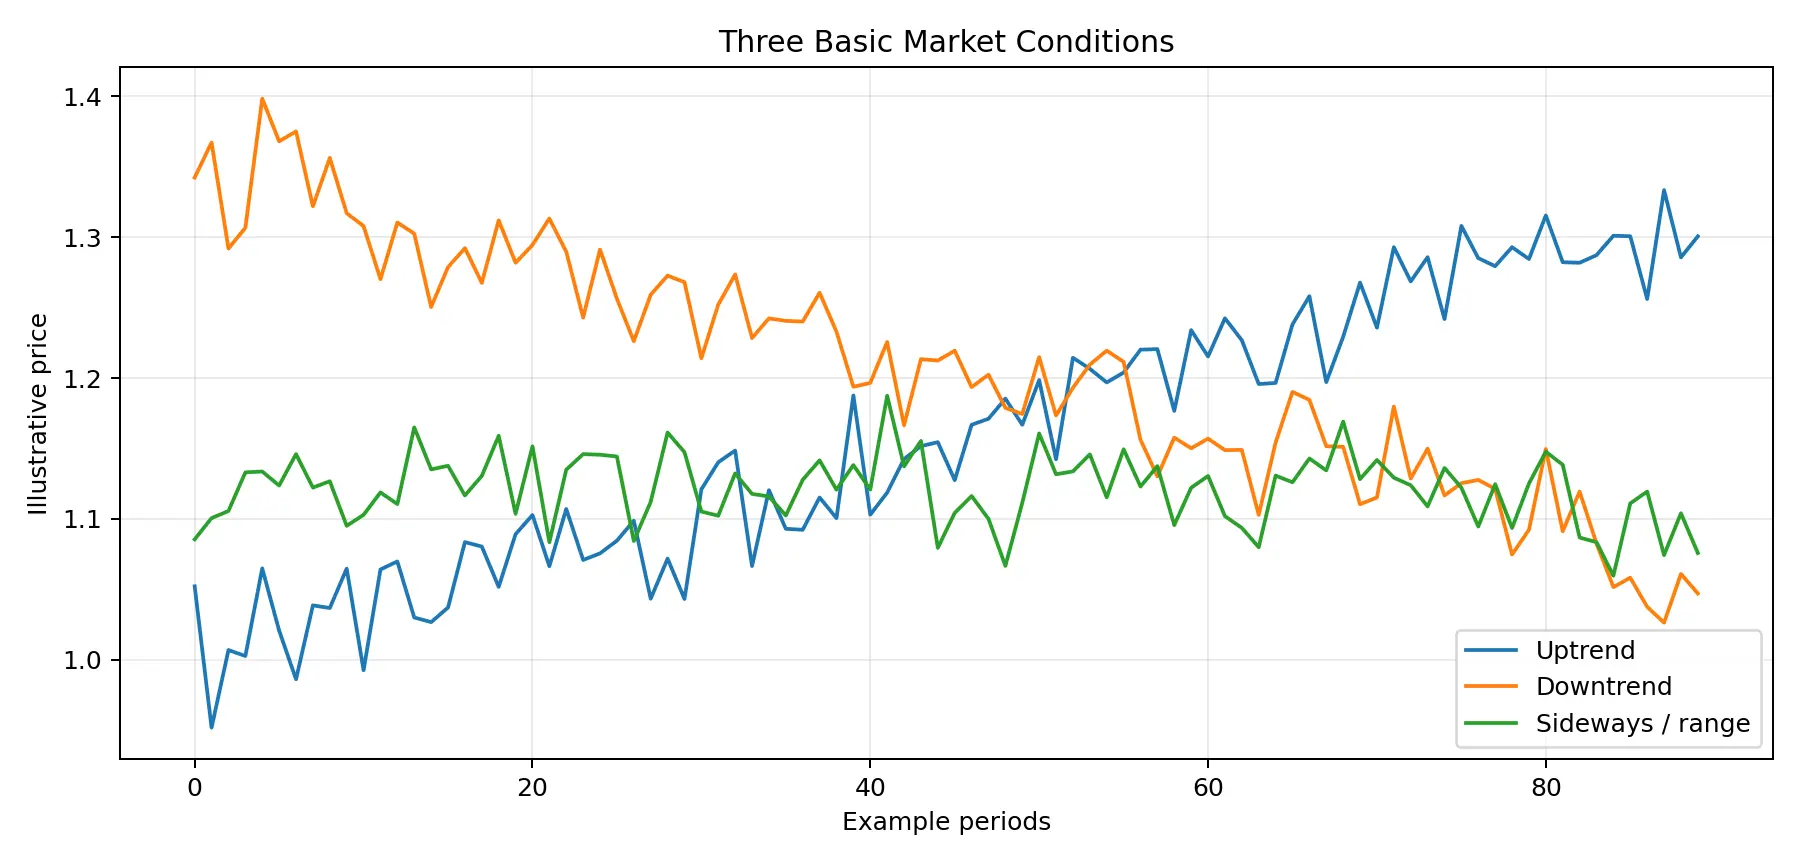
A trend is a sustained directional pattern in price. An uptrend typically forms higher highs and higher lows; a downtrend forms lower highs and lower lows; a sideways market moves between support and resistance without sustained directional progress.
Types of Trends: Uptrend, Downtrend and Sideways
How to Identify and Trade With Trends
Start with swing structure rather than an indicator. If EUR/USD continues to make higher highs and higher lows, the technical bias is bullish until the structure breaks. Trend traders often wait for pullbacks toward support, moving averages or prior breakout zones instead of buying after an extended move. In a downtrend, the same logic is reversed.
A trend does not move in a straight line. Counter-trend corrections are normal. The challenge is deciding whether a pullback is temporary or the beginning of a structural reversal.
3. Types of Charts
Line Charts
A line chart normally connects closing prices. It removes much of the intraperiod noise and is useful for seeing broad direction, long-term support/resistance and clean trend structure.
Bar Charts
A bar chart shows open, high, low and close for each period. It provides more information than a line chart while keeping a compact appearance.
Candlestick Charts
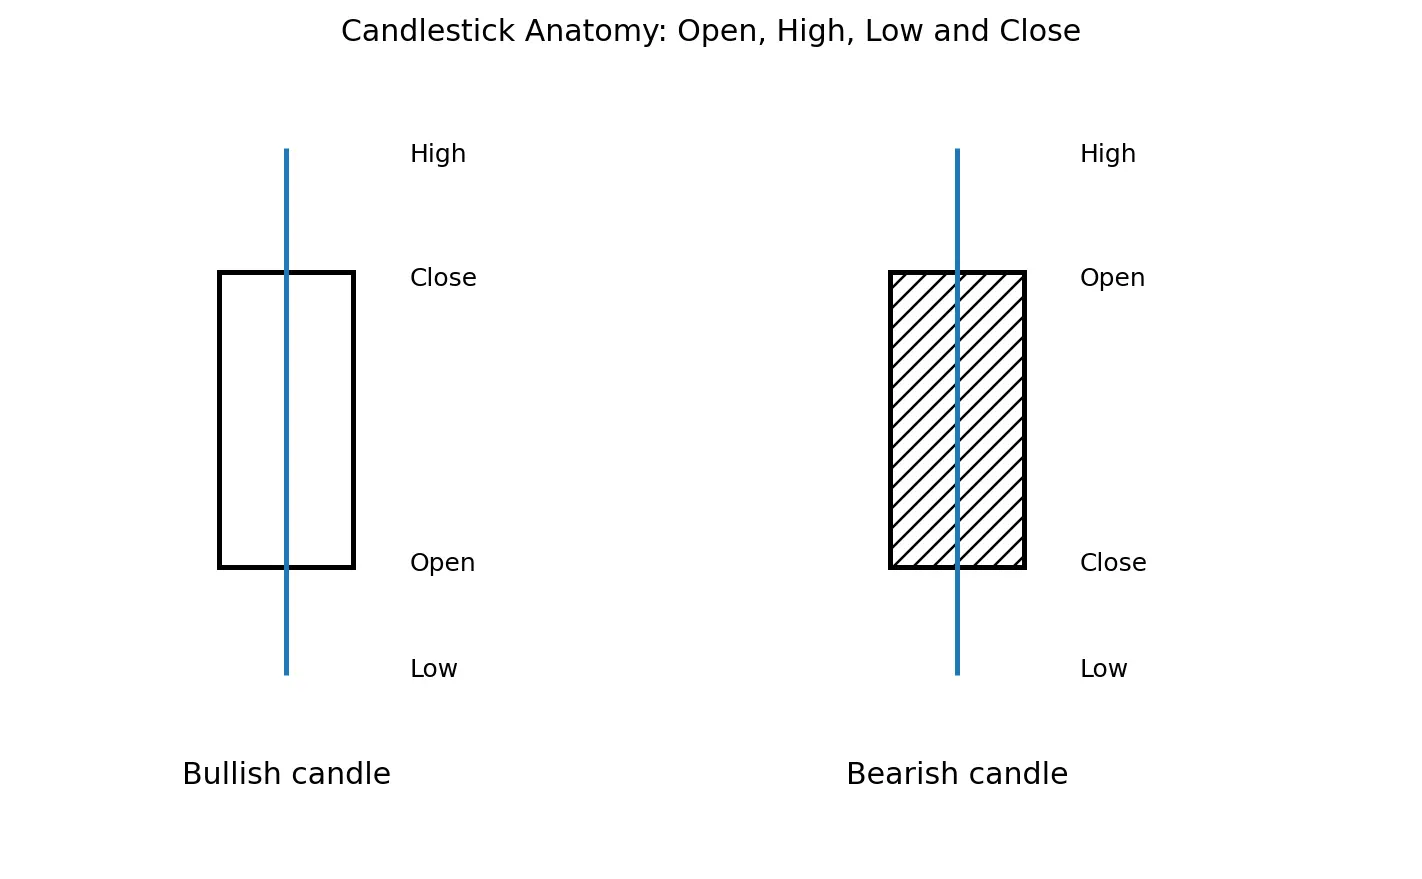
Candlestick charts show the same OHLC information as bars but use a body and wicks that make the relationship between the open and close easier to read.
Advantages and Uses of Each Chart Type
| Chart | Best use | Limitation |
|---|---|---|
| Line | Clean long-term trend and closing-price view | Hides intraperiod highs/lows |
| Bar | Full OHLC data in a compact format | Less visually intuitive for many beginners |
| Candlestick | Price action, rejection, momentum and pattern reading | Can encourage over-analysis of individual candles |
4. Support and Resistance
Definition and Importance of Support and Resistance Levels
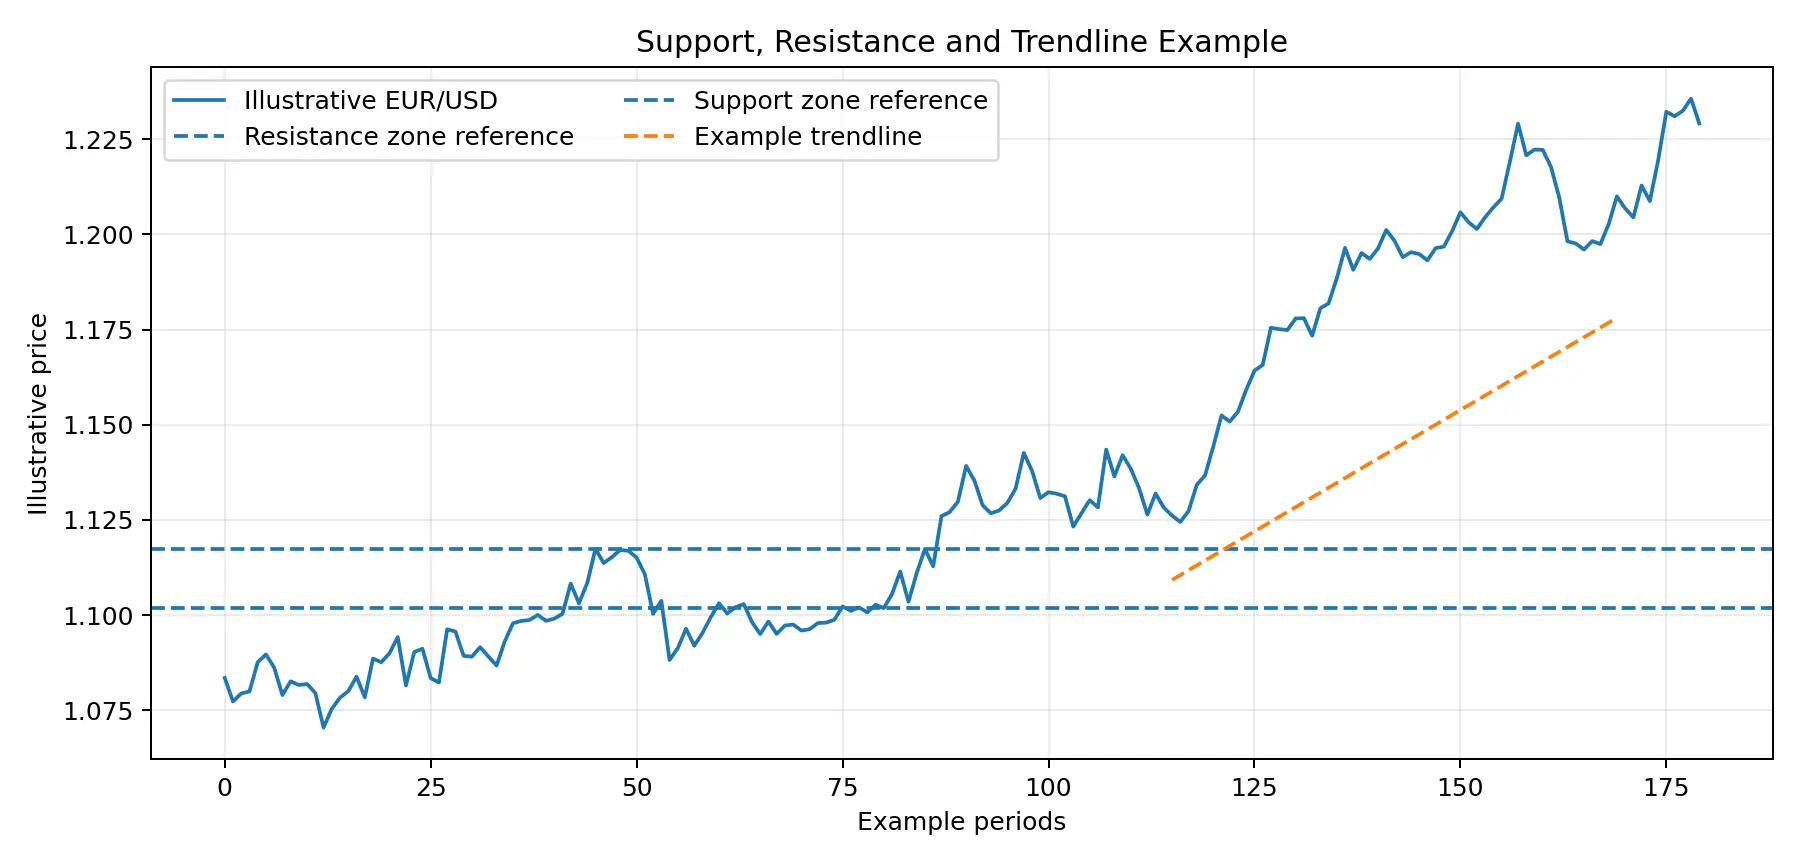
Support is an area where buying previously became strong enough to slow or reverse a decline. Resistance is an area where selling previously became strong enough to slow or reverse a rally. In live markets, these are better treated as zones than as perfect single-price lines.
How to Identify Support and Resistance
Look for repeated swing highs/lows, prior breakout areas, round numbers, consolidation boundaries and high-timeframe turning points. The more visible the level across multiple timeframes, the more attention it may attract.
Trading Strategies Based on Support and Resistance
Common approaches include buying a confirmed rejection from support, selling a rejection from resistance, trading a breakout after a close beyond the zone, or waiting for a breakout-retest. False breaks are common, so confirmation and a predefined invalidation level matter.
5. Pivot Points
What Are Pivot Points?
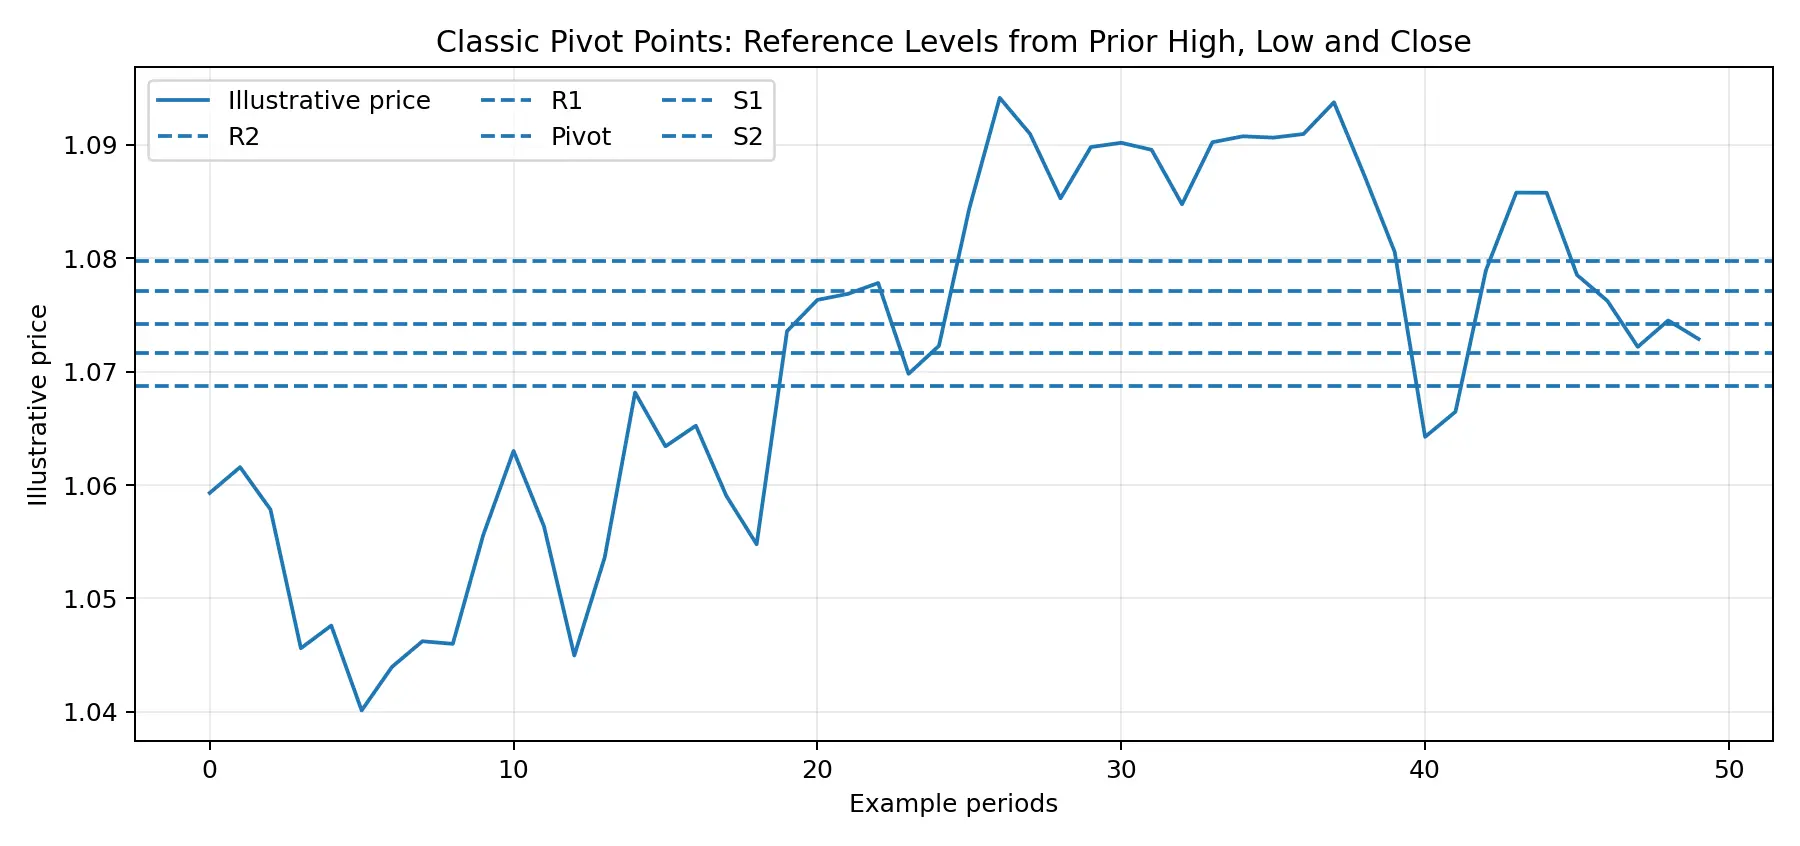
Pivot points are calculated reference levels derived from a prior period’s high, low and close. They are widely used by intraday traders to map possible support, resistance and directional bias.
How to Calculate and Use Pivot Points in Trading
Classic Pivot (P) = (High + Low + Close) / 3
R1 = 2P – Low | S1 = 2P – High
R2 = P + (High – Low) | S2 = P – (High – Low)
Pivot Point Trading Strategies
Traders may use price above the central pivot as a bullish intraday bias and price below it as bearish context. Rejections at S1/R1 can become range setups; breaks through R1/S1 can become momentum setups. The level alone is not enough – price reaction, session context and volatility should confirm the idea.
6. Introduction to Technical Indicators
Role of Technical Indicators in Trading
Indicators transform price, time or volume-related information into a measurement that is easier to compare. Their job is to quantify something specific – trend, momentum, volatility or participation – not to forecast perfectly.
Categories of Indicators: Trend, Momentum, Volatility and Volume
| Category | Examples | What it measures |
|---|---|---|
| Trend | Moving averages, ADX, Parabolic SAR, Aroon | Direction or trend strength |
| Momentum | RSI, MACD, Stochastic, Momentum, CCI, RVI | Speed/strength of price movement |
| Volatility | ATR, Bollinger Bands, standard deviation | How much price is moving |
| Volume / participation | Force Index, OBV-style tools | Participation; in spot FX often based on tick volume rather than centralised volume |
How to Choose the Right Indicators for Your Strategy
Choose indicators that answer different questions. A moving average plus RSI can make sense because one measures trend and the other momentum. Five momentum oscillators usually add less information because they are largely measuring the same price behaviour. For a focused explanation of the formula, 80/20 zones, %K/%D crossovers and divergence, use the Stochastic RSI guide. For another range-position oscillator, the Williams %R guide explains its formula, -20/-80 zones, midpoint and divergence.
7. How to Use a Heikin-Ashi Chart
Explanation of Heikin-Ashi Charts
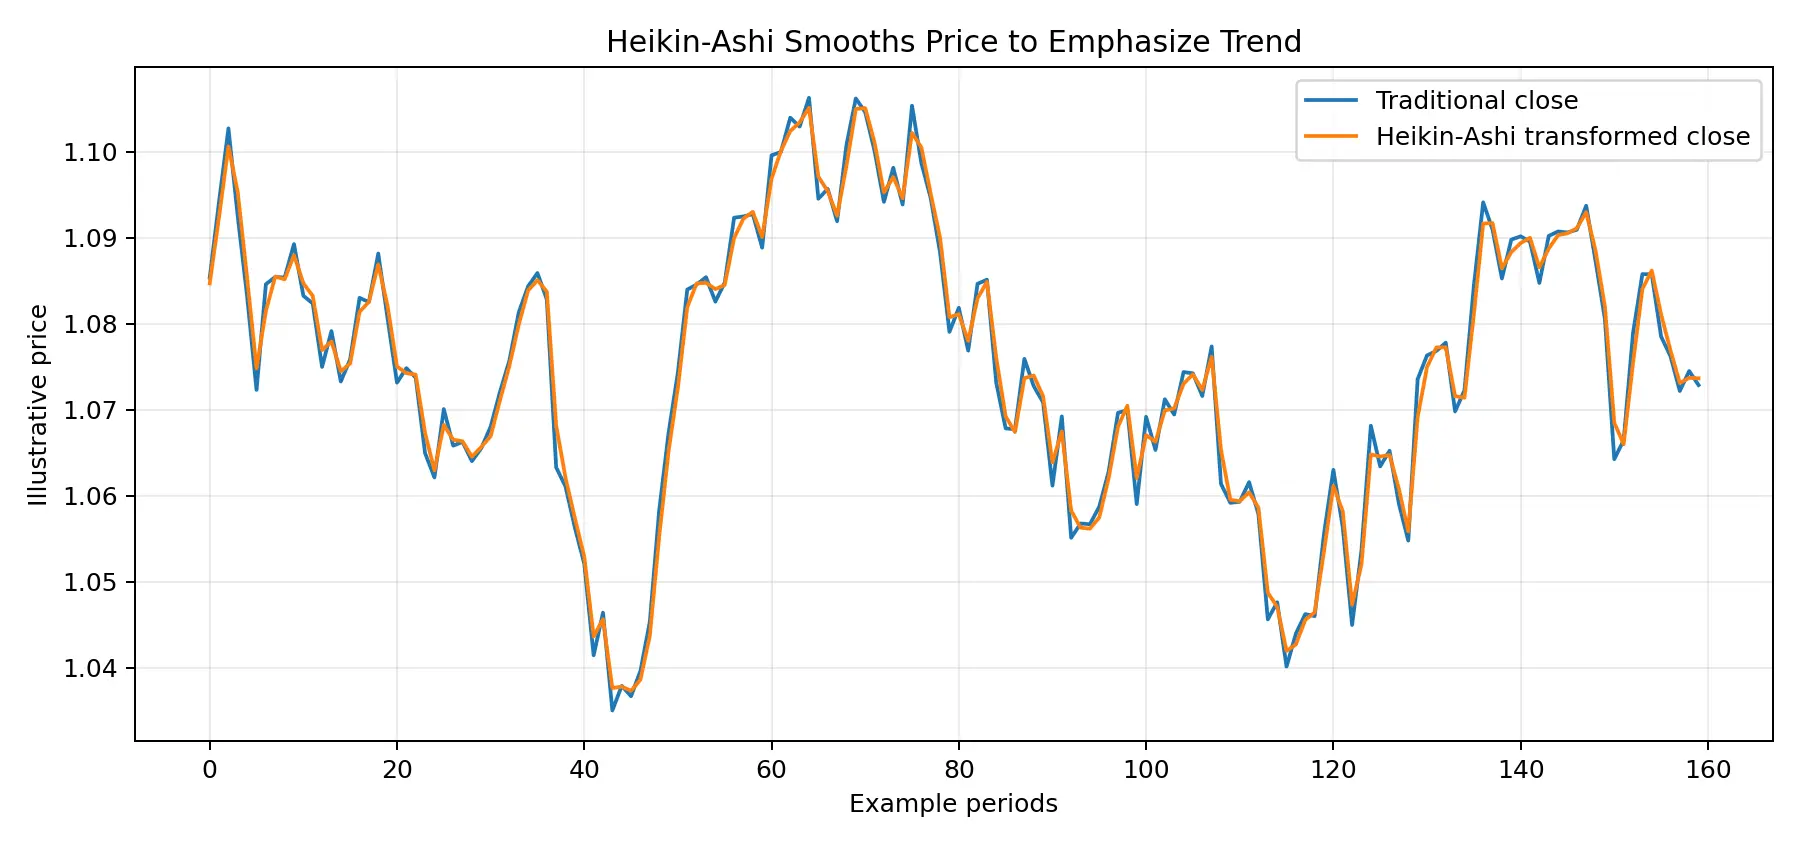
Heikin-Ashi uses transformed OHLC values to smooth normal candlestick noise. The displayed candles are calculated from current and prior data rather than representing the exact raw open and close of the market.
HA Close = (Open + High + Low + Close) / 4
HA Open = (Previous HA Open + Previous HA Close) / 2
Advantages of Heikin-Ashi Over Traditional Candlesticks
Heikin-Ashi can make directional trends and pauses visually clearer because it reduces some one-candle noise. The trade-off is that it can hide exact market opens/closes and may lag price.
Trading Strategies Using Heikin-Ashi Charts
A common trend-following approach looks for consecutive same-direction candles, small or absent counter-trend wicks and continuation after a pause. Use a normal price chart for exact order and stop placement because Heikin-Ashi prices are transformed.
8. What Is a ZigZag Indicator?
Overview of the ZigZag Indicator
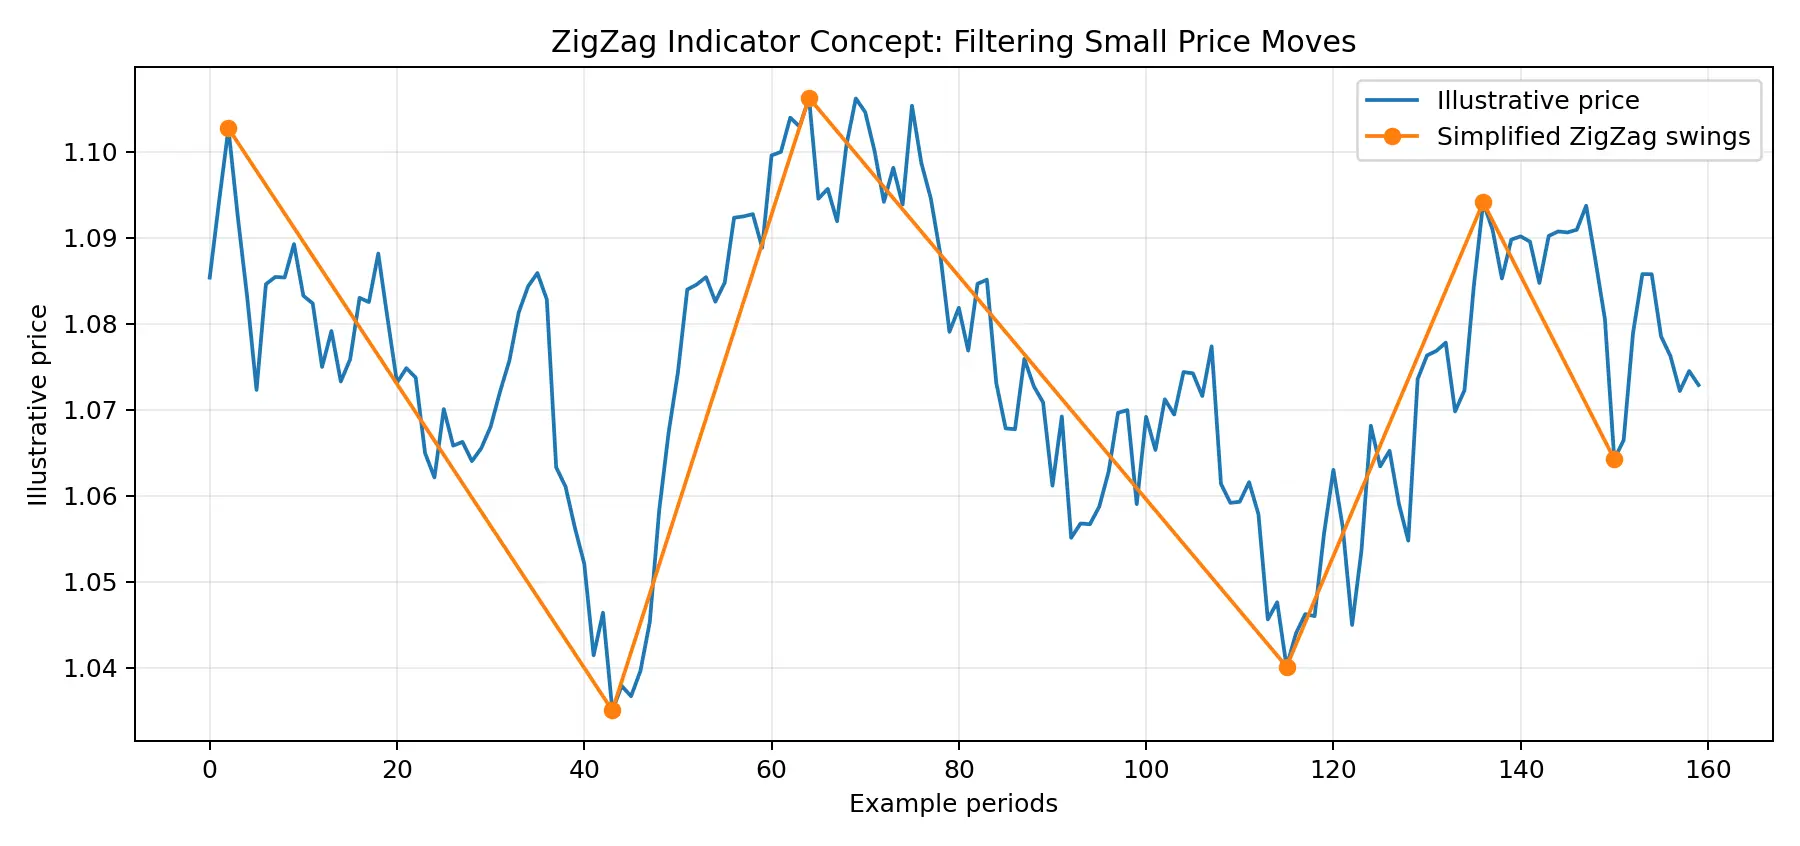
The ZigZag indicator connects meaningful swing highs and lows while ignoring price movements smaller than a chosen threshold. It is a visual filtering tool rather than a predictive indicator.
How to Use ZigZag to Identify Trends
If the filtered swings show higher highs and higher lows, the larger structure is bullish; lower highs and lower lows indicate bearish structure. ZigZag can also make chart patterns and Fibonacci swing selection easier.
Practical Applications of the ZigZag Indicator
Use ZigZag for swing mapping, wave comparison and pattern study – not as a real-time signal. The most recent leg can change as new highs or lows form, so it can “repaint” until a swing is confirmed.
9. Renko Charts
Introduction to Renko Charts
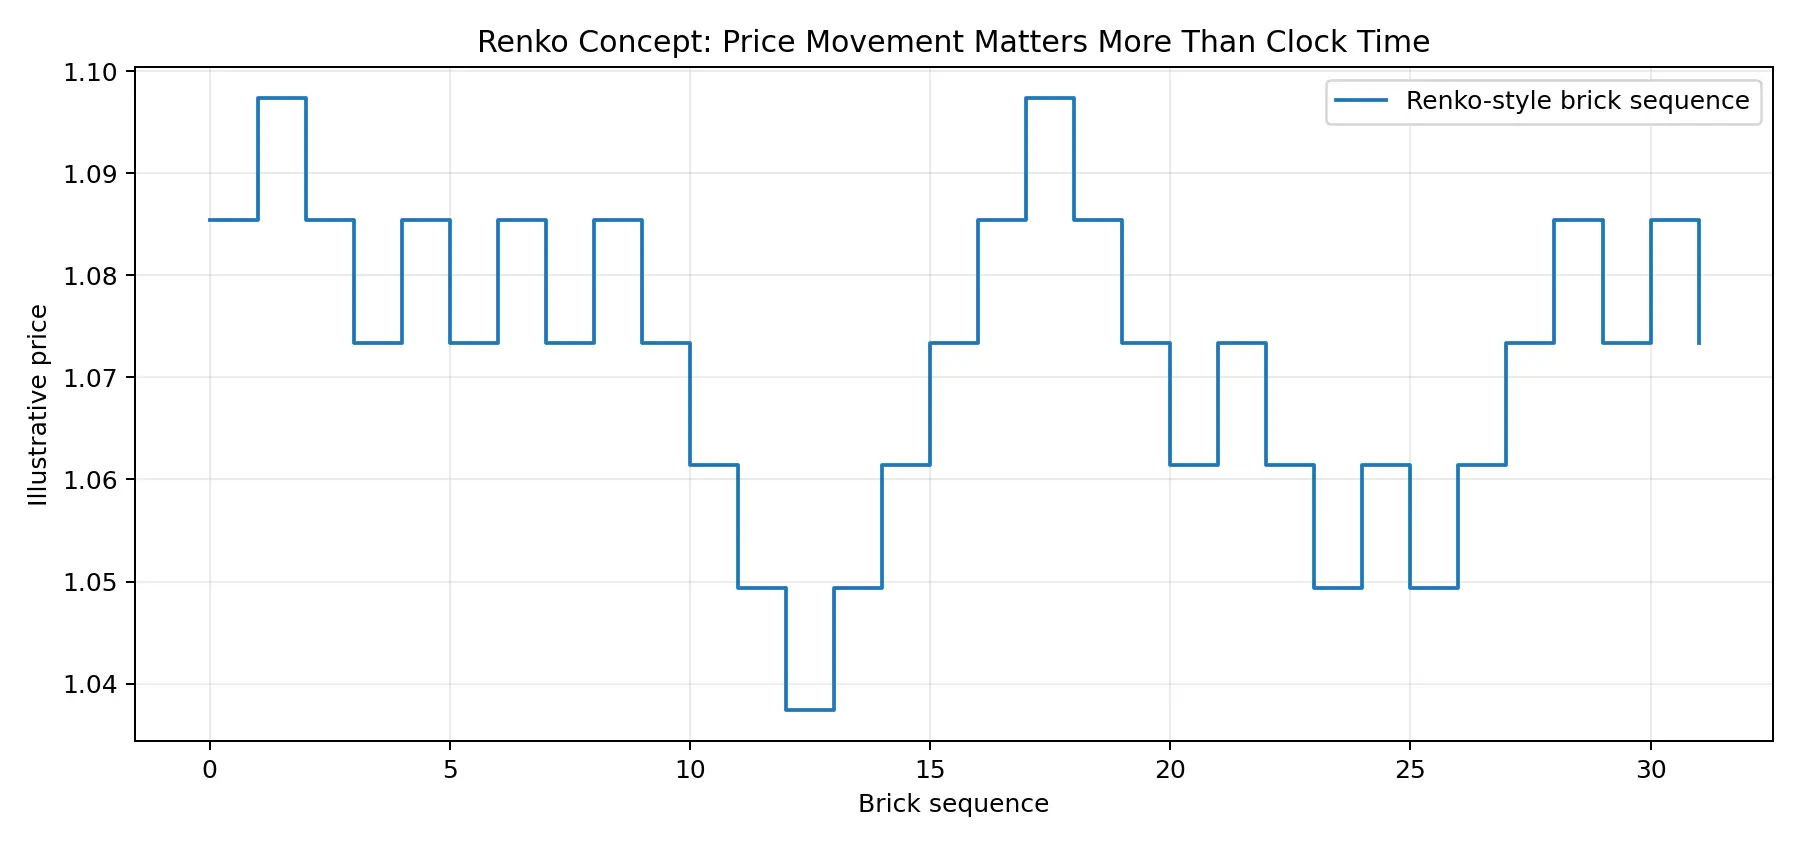
Renko charts build new bricks after price moves by a specified brick size. Clock time is secondary: one brick may form quickly in a volatile market and slowly in a quiet one.
How Renko Charts Differ From Traditional Charts
Traditional candlesticks print each time period even if price barely moves. Renko filters smaller moves and can make trends appear cleaner, but it removes time detail and can hide the exact path price took between bricks.
Benefits of Using Renko Charts for Trend Analysis
Renko can be useful for trend-following, breakout filtering and reducing noise. Brick size is crucial: too small creates noise; too large delays signals. Use the actual broker price for execution and risk management.
10. Japanese Candlestick Charts
Basics of Japanese Candlestick Charts
Each candlestick shows the open, high, low and close for a chosen timeframe. The body shows the distance between open and close, while wicks show extremes reached during the period.
Key Candlestick Patterns and Their Meanings
Doji
Open and close are close together; can signal indecision, especially after an extended move.
Hammer / Pin Bar
Long lower wick can show rejection of lower prices when it appears near support.
Shooting Star
Long upper wick after a rally can show rejection of higher prices near resistance.
Bullish/Bearish Engulfing
A large candle body overtakes the prior body, suggesting a strong shift in short-term control.
Inside Bar
Range contracts inside the prior candle, often creating a breakout decision point.
How to Trade Using Candlestick Patterns
A candlestick pattern is much more useful at a meaningful level than in the middle of random price action. Combine the pattern with trend, support/resistance and invalidation. A bullish engulfing candle at major support is a different setup from the same candle after an extended vertical rally.
11. Trend Indicators
Explanation of Trend Indicators
Trend indicators help identify the direction or strength of sustained price movement. They are most effective when markets are directional and can become noisy during ranges.
Popular Trend Indicators and Their Uses
Moving averages: Smooth price and provide trend context.
ADX: Measures trend strength rather than direction.
Parabolic SAR: Places trailing reference dots that can support trend-following and stop management.
Aroon: Measures how recently highs and lows occurred to estimate trend development.
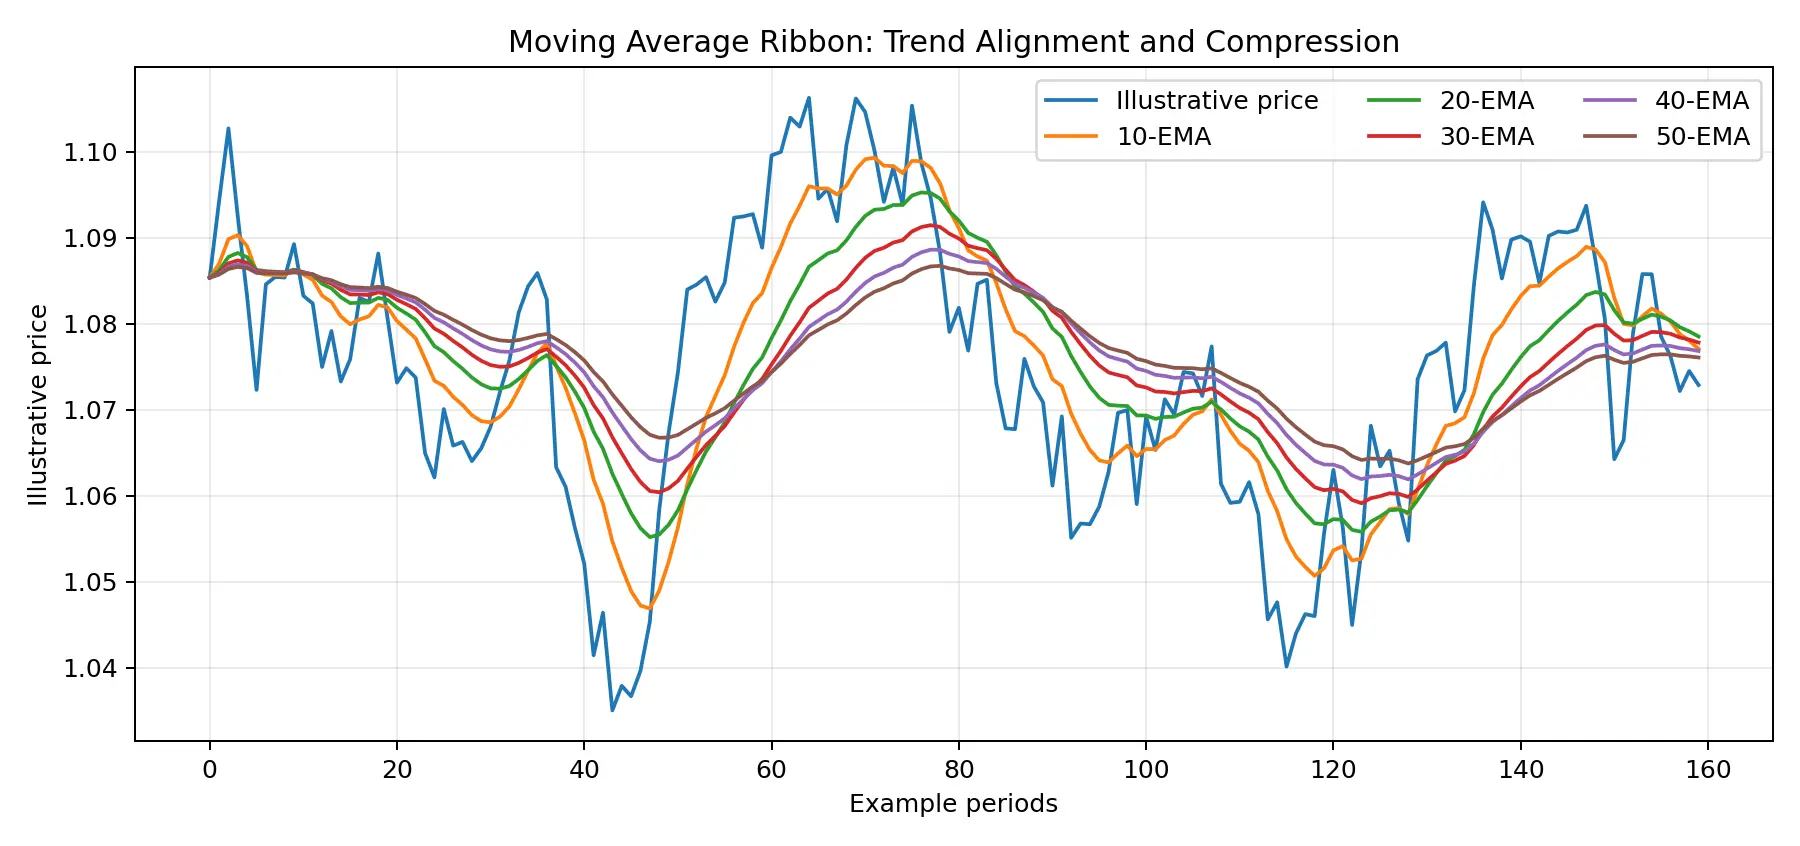
Moving average ribbon: Uses several averages to visualise alignment, compression and expansion.
12. Moving Averages Ribbon: How to Find Entry Points
What Is a Moving Averages Ribbon?
A moving-average ribbon plots several averages with different lookback periods on the same chart. When shorter averages are above longer averages and the group is expanding, the trend can be strongly bullish; the opposite alignment can be bearish.
How to Use the Ribbon to Identify Entry Points
Rather than entering on every crossover, traders often wait for price to pull back toward the ribbon during an established trend and then look for renewed momentum. Compression or tangled averages indicate a less directional market.
Moving Average Ribbon Trading Strategies
Common methods include trend continuation after a pullback, breakout confirmation when the ribbon expands, and trend-change warnings when the short averages cross and remain on the opposite side of the longer averages.
13. Moving Averages
Types of Moving Averages: Simple and Exponential
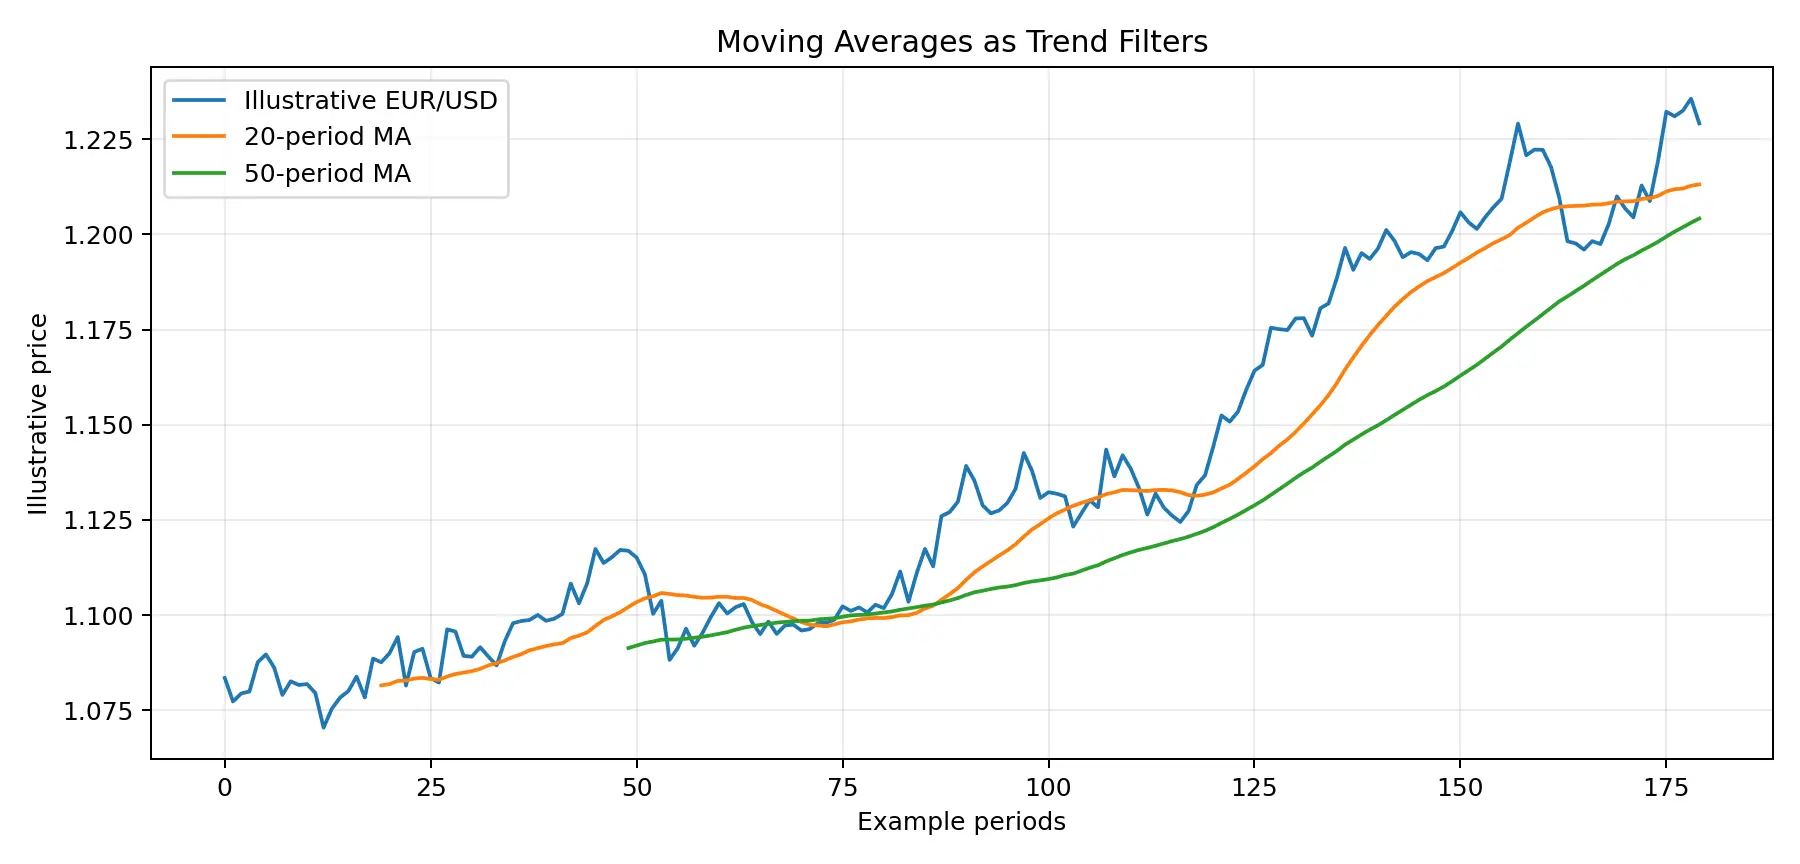
A Simple Moving Average gives each observation equal weight. An Exponential Moving Average gives more weight to recent prices, so it usually responds faster to new movement.
How to Use Moving Averages for Trend Analysis
Rising averages, price holding above them and bullish alignment can support an uptrend view. Falling averages and price below them can support a downtrend view. The slope and price structure matter more than the exact period.
Moving Average Trading Strategies
Common strategies include pullbacks to an average, fast/slow crossovers and using a longer average as a regime filter. Crossovers lag and can whipsaw badly in sideways markets.
14. Standard Deviation
Definition and Calculation of Standard Deviation
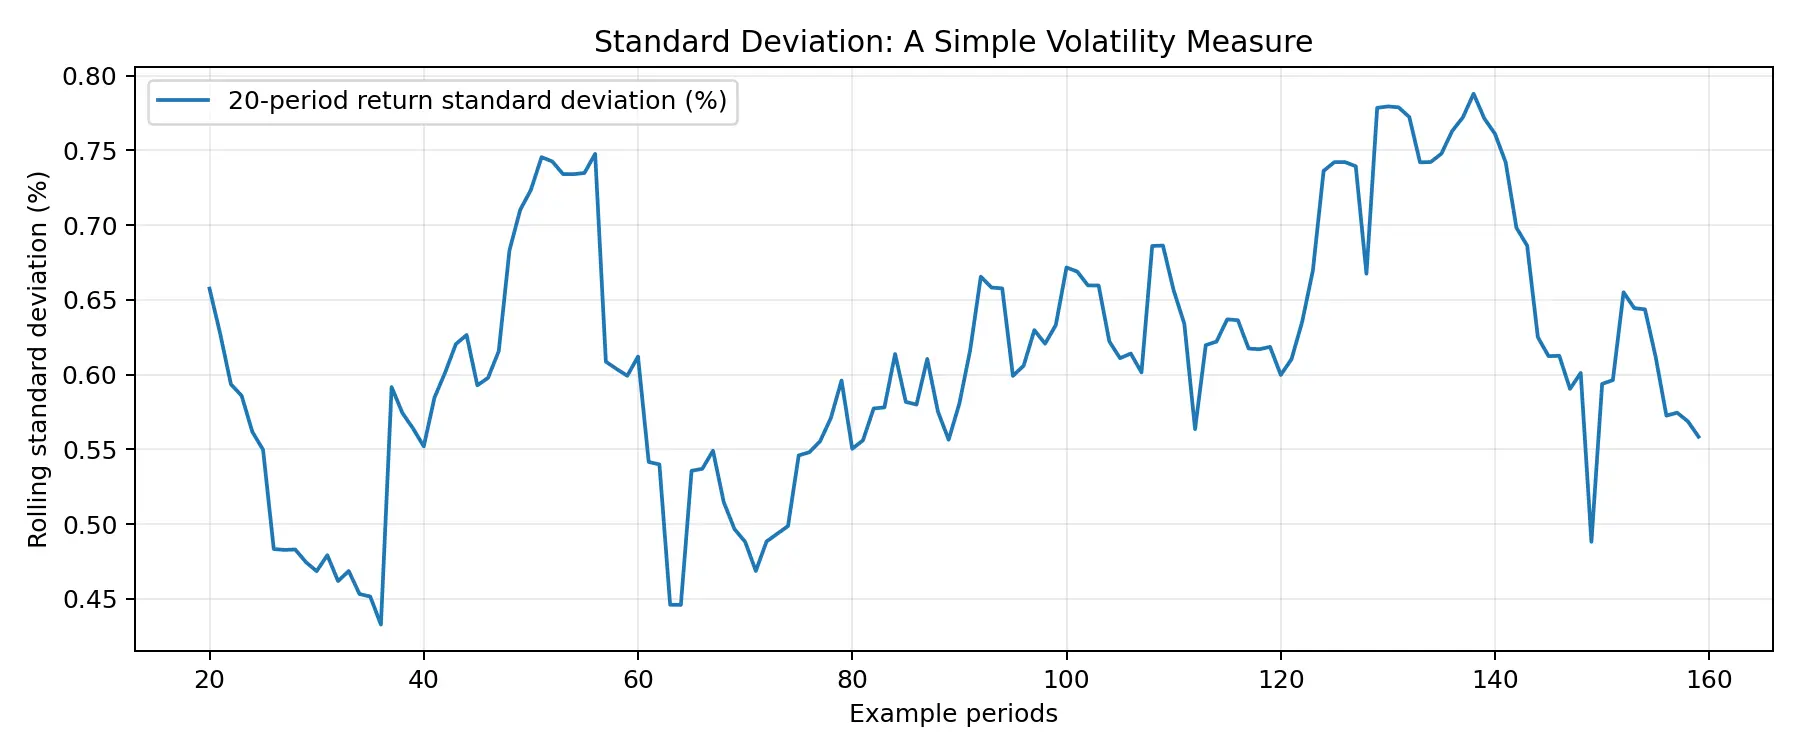
Standard deviation measures how dispersed values are around an average. In trading, it is often applied to prices or returns as a measure of variability. Higher standard deviation generally means recent movement has been more volatile.
How Standard Deviation Is Used in Trading
It is the statistical foundation of tools such as Bollinger Bands and can help compare quiet and volatile regimes. A high reading does not tell you direction – only dispersion.
Incorporating Standard Deviation Into a Trading Strategy
Use it to adjust stop expectations, distinguish volatility expansion from compression, or decide whether a strategy designed for quiet markets is operating in the wrong environment.
15. Parabolic SAR
Introduction to Parabolic SAR
Parabolic Stop and Reverse (SAR) plots a sequence of dots that trail price. Dots below price are associated with an uptrend phase; dots above price are associated with a downtrend phase.
How to Use Parabolic SAR for Trend Following
The indicator accelerates as a trend develops. It can help trail a stop or highlight a potential trend shift when the dots flip sides. It performs poorly in choppy ranges because flips can occur repeatedly.
Parabolic SAR Trading Strategies
One approach combines SAR with a moving-average trend filter: take SAR flips only in the direction of the larger trend. Another uses the dots as a trailing exit reference rather than an entry signal.
16. ADX Indicator: Effective Forex Trend-Strength Analysis
What Is the ADX Indicator?
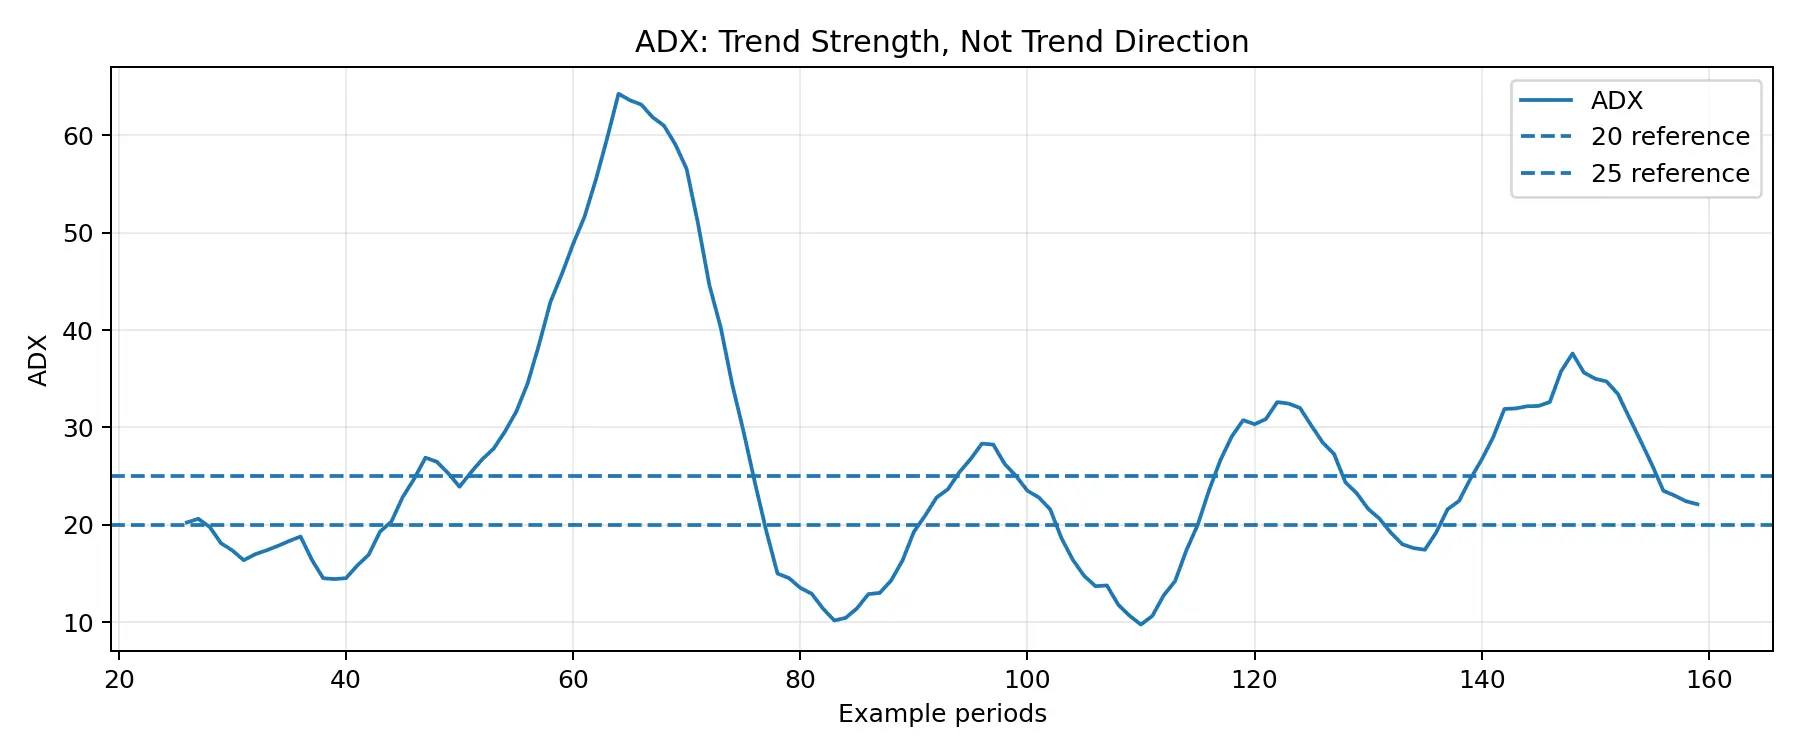
The Average Directional Index is part of Welles Wilder’s Directional Movement system. ADX measures trend strength while +DI and -DI provide directional context.
How to Interpret ADX Readings
Traders commonly view readings below roughly 20 as weak trend conditions and readings above roughly 25 as stronger trend conditions. These are conventions rather than fixed laws; compare ADX with price structure and the pair’s normal behaviour.
Using ADX for Trend Strength and Trading
ADX can filter trend strategies: a breakout may be more attractive when ADX is rising than when ADX is falling in a range. Avoid using ADX as a bullish/bearish signal by itself.
17. Bollinger Bands
Explanation of Bollinger Bands
Bollinger Bands use a moving average with upper and lower bands commonly set two standard deviations away. The bands expand and contract with recent volatility.
How to Use Bollinger Bands for Volatility Analysis
Narrow bands can indicate volatility compression; widening bands show expansion. Price reaching a band is not automatically a reversal signal – strong trends can ride an outer band.
Bollinger Bands Trading Strategies
Common approaches include squeeze breakouts, trend continuation along an outer band and mean-reversion setups inside established ranges. The market regime determines which interpretation is more appropriate.
18. Oscillators
Role of Oscillators in Trading
Oscillators convert price behaviour into a bounded or fluctuating measure that helps compare momentum, overbought/oversold conditions or trend cycles. They are especially useful in ranges but can remain extreme during strong trends.
Overview of Common Oscillators
RSI
Stochastic Oscillator
Williams %R
CCI
Relative Vigor Index
Aroon (trend-cycle tool)
Momentum / Rate of Change
MACD (unbounded momentum/trend oscillator)
19. Aroon Indicator Trading Strategy
What Is the Aroon Indicator?
Aroon measures how recently the highest high and lowest low occurred within a chosen lookback. Aroon Up rises when recent highs are close to the present; Aroon Down rises when recent lows are close to the present.
How to Use Aroon to Identify Trends
A high Aroon Up with low Aroon Down supports bullish trend conditions; the opposite supports bearish conditions. Both lines moving near each other can indicate consolidation.
Aroon Trading Strategies
Traders may use Aroon crossovers as a secondary confirmation after price breaks structure. Because the indicator is derived from the timing of highs/lows, it can react differently from momentum oscillators and can be useful as a trend-state filter.
20. Momentum
Definition of Momentum in Trading
Momentum describes the speed or strength of a price move. A trend can still be rising while momentum slows, which is why momentum indicators can warn that a move is losing force before the trend structure fully reverses.
Popular Momentum Indicators
RSI
MACD histogram
Stochastic Oscillator
Momentum / Rate of Change
CCI
RVI
Force Index
How to Incorporate Momentum Analysis Into Trading
Use momentum to confirm breakouts, identify divergence, or avoid chasing a trend that is visibly losing energy. Momentum alone does not tell you where support or resistance is, so combine it with structure.
21. Bulls Power and Bears Power
Explanation of Bulls Power and Bears Power
Developed by Alexander Elder, Bulls Power compares the period high with an EMA, while Bears Power compares the period low with the EMA.
Bulls Power = High – EMA
Bears Power = Low – EMA
Using the Indicators to Gauge Market Strength
Positive and rising Bulls Power suggests buyers are pushing price farther above the average. Negative Bears Power shows sellers can push below the average. The indicators are most useful when read together with the EMA trend.
Trading Strategies Using Bulls and Bears Power
A classic approach looks for bullish setups when the EMA is rising and Bears Power improves from negative levels, or bearish setups when the EMA is falling and Bulls Power weakens. Divergence can add context but is not a guaranteed reversal.
22. Average True Range (ATR)
What Is ATR?
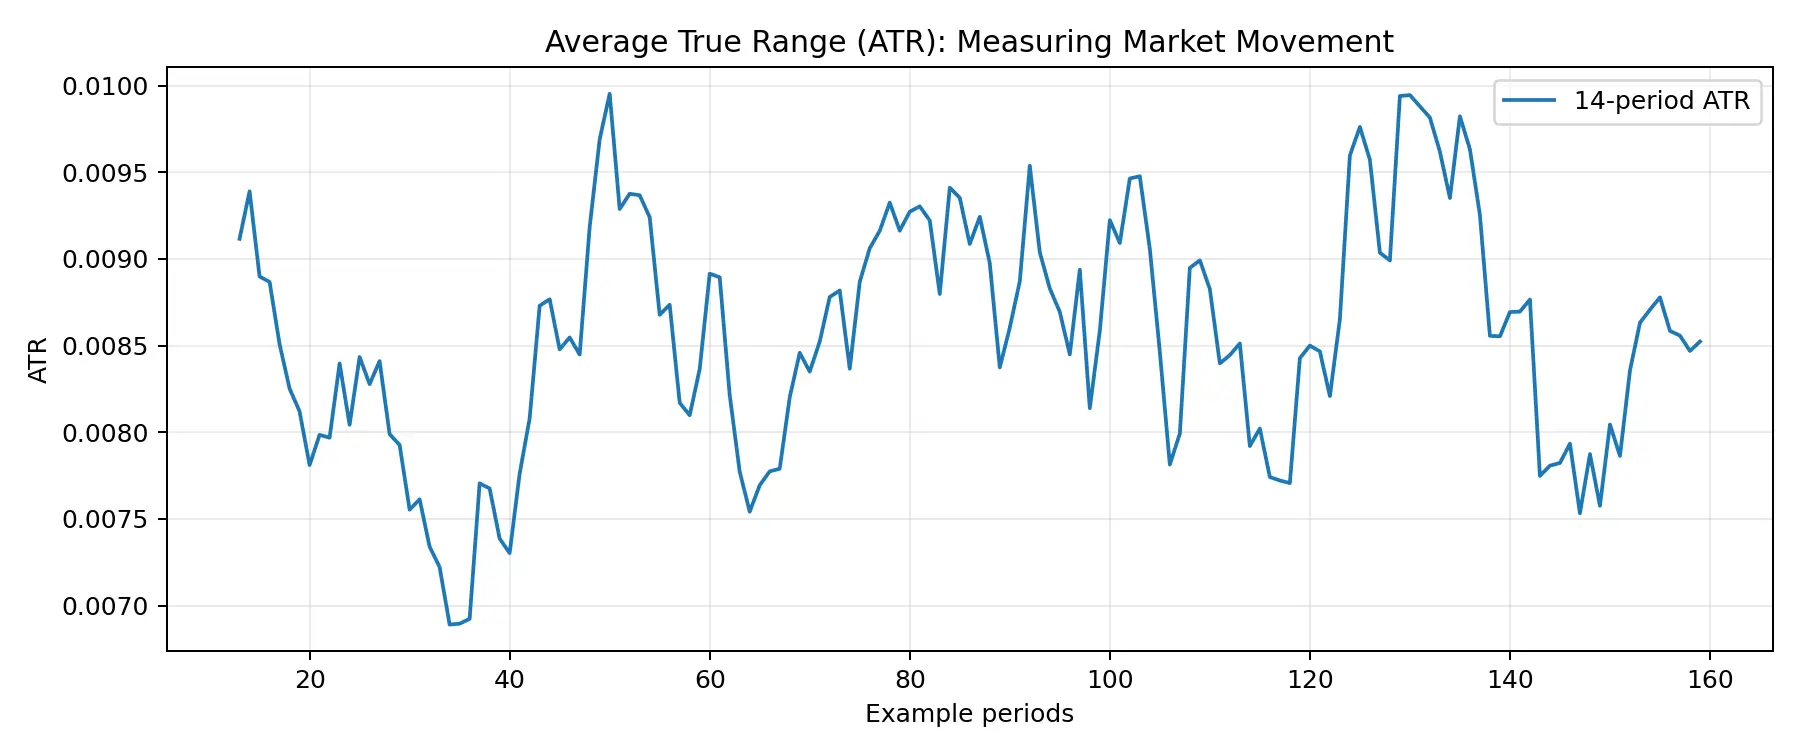
ATR measures average true range, which includes the current high-low range and gaps relative to the prior close. It is a volatility indicator, not a directional indicator.
How to Use ATR for Volatility Analysis
ATR helps compare whether a stop or target is realistic relative to recent movement. A 20-pip stop may be generous in a quiet pair and extremely tight during a high-volatility event.
ATR Trading Strategies
Common uses include ATR-based stops, volatility-adjusted position sizing and breakout filters. For example, a trader may place a stop a chosen multiple of ATR beyond a technical level rather than using the same fixed pip distance on every trade.
ATR defines distance, but account risk still depends on position size. Use it with the position-sizing workflow in the Forex Trading Tools and Resources guide rather than choosing lot size from leverage alone.
23. Trading With the Stochastic Oscillator
Introduction to the Stochastic Oscillator
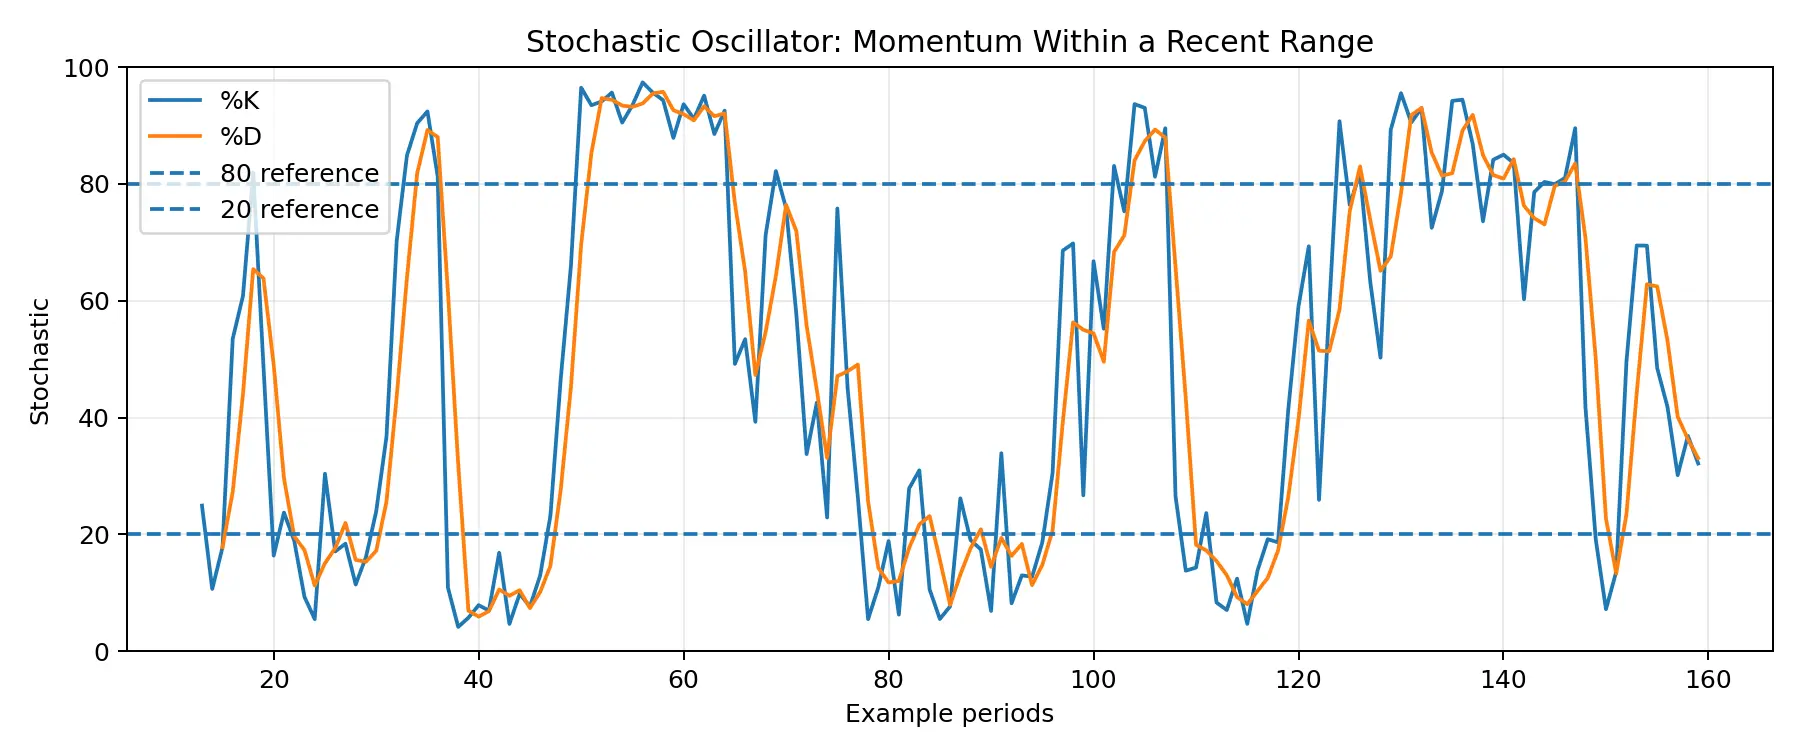
The Stochastic Oscillator compares the current close with the recent high-low range. %K is the faster line and %D is commonly a smoothed average of %K.
How to Interpret Stochastic Signals
Readings above 80 are commonly called overbought and below 20 oversold, but trends can keep the oscillator extreme. Crossovers and divergence become more useful when they occur at structural support/resistance.
Stochastic Trading Strategies
In ranges, traders may look for momentum turns from extreme zones. In trends, a better use can be waiting for the oscillator to reset during a pullback and then turn back in the trend direction.
24. MACD (Moving Average Convergence/Divergence)
Overview of MACD
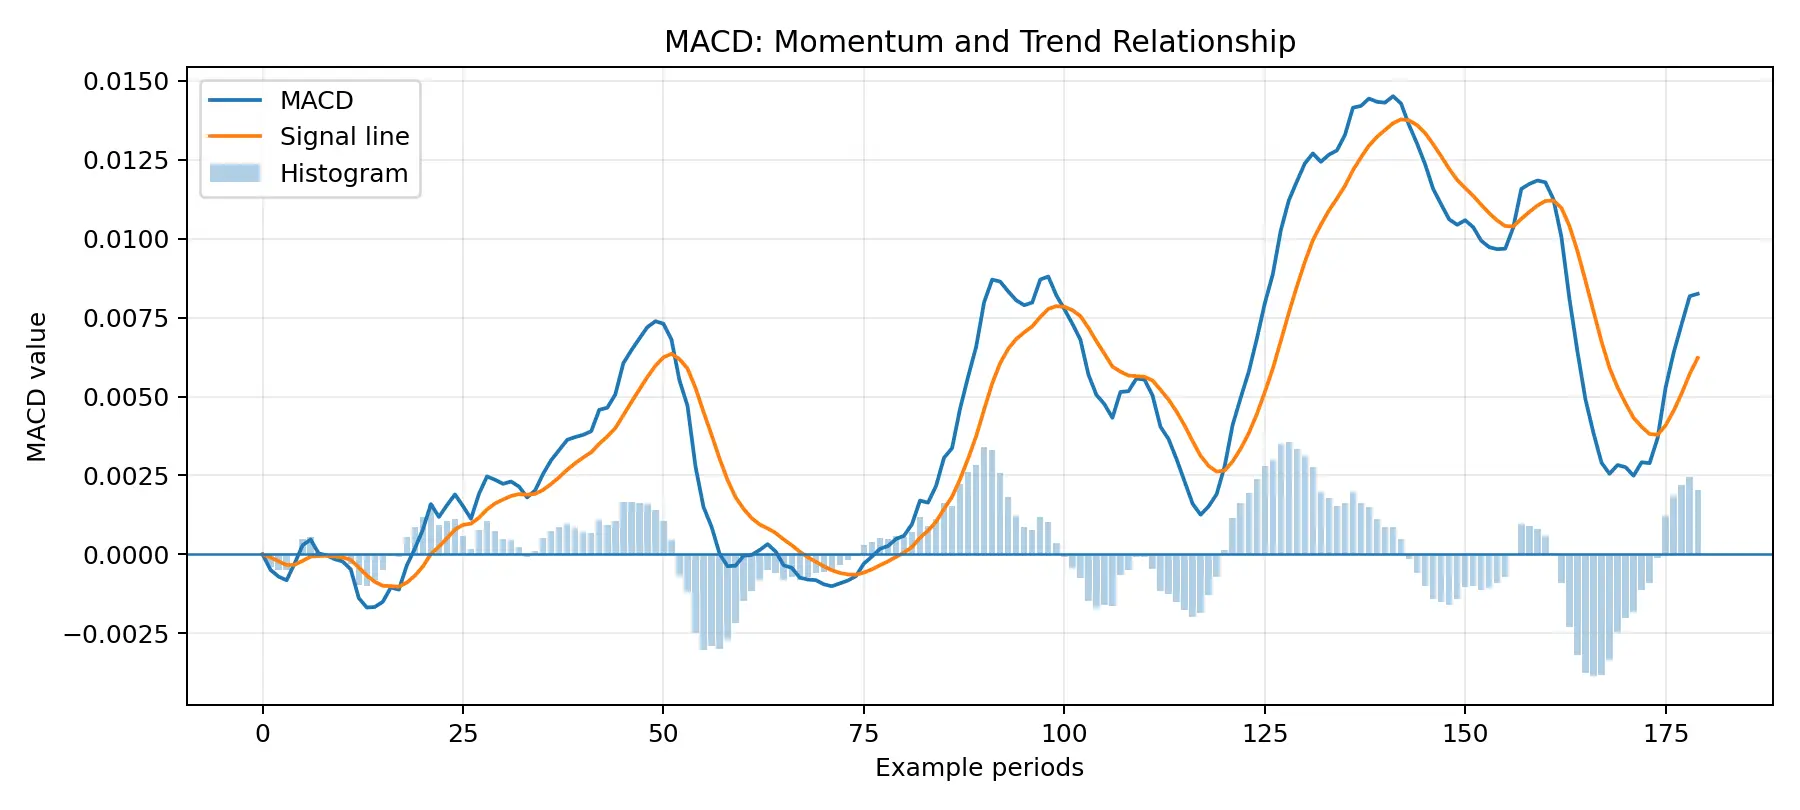
MACD is typically calculated as the difference between a 12-period EMA and 26-period EMA, with a 9-period EMA signal line. The histogram shows the difference between MACD and its signal line.
MACD = 12-period EMA – 26-period EMA
How to Use MACD for Trend and Momentum Analysis
Signal-line crossovers, zero-line position and histogram expansion/contraction can all add context. A crossover aligned with a breakout has more value than repeated crossovers inside a sideways range.
MACD Trading Strategies
Common methods include trend confirmation, pullback re-entry, divergence and zero-line continuation. Avoid treating every crossover as a buy or sell instruction.
25. CCI (Commodity Channel Index)
What Is the Commodity Channel Index?
CCI measures how far the typical price is from its recent statistical average. Although the name refers to commodities, the indicator is widely used across financial markets, including forex.
How to Use CCI for Trends and Reversals
Readings above +100 or below -100 are common reference levels for strong deviations, but the indicator is unbounded and can remain extreme. CCI can help identify momentum expansion, pullbacks and divergence.
CCI Trading Strategies
Trend traders may use a return through +100/-100 as a momentum trigger; range traders may look for reversals from extremes. Always check the prevailing price structure before deciding which interpretation fits.
26. What Is the Envelopes Indicator?
Explanation of the Envelopes Indicator
Moving Average Envelopes place upper and lower bands a fixed percentage above and below a moving average. Unlike Bollinger Bands, the distance is percentage-based rather than determined by standard deviation.
How to Use Envelopes to Identify Trading Opportunities
The centre average gives trend context, while the outer bands can highlight stretched movement or breakout conditions. The appropriate percentage depends on pair volatility and timeframe.
Envelopes Trading Strategies
Range traders may fade moves near an envelope when structure supports mean reversion; trend traders may use sustained closes outside a band as evidence of momentum. Fixed settings should be tested rather than copied blindly.
27. Relative Vigor Index (RVI)
Introduction to the Relative Vigor Index
RVI is based on the idea that in an uptrend prices tend to close above their opens, while in a downtrend they tend to close below. It compares close-open movement with the high-low range and smooths the result.
How to Use RVI for Momentum Analysis
Traders compare the RVI line with its signal line and watch the relationship with the zero area. Rising values can support bullish momentum; falling values can support bearish momentum.
RVI Trading Strategies
Use RVI crossovers as confirmation after price structure or a trend filter has already created a directional bias. Divergence can be monitored, but it can persist for a long time before price reverses.
28. Relative Strength Index (RSI)
What Is RSI?
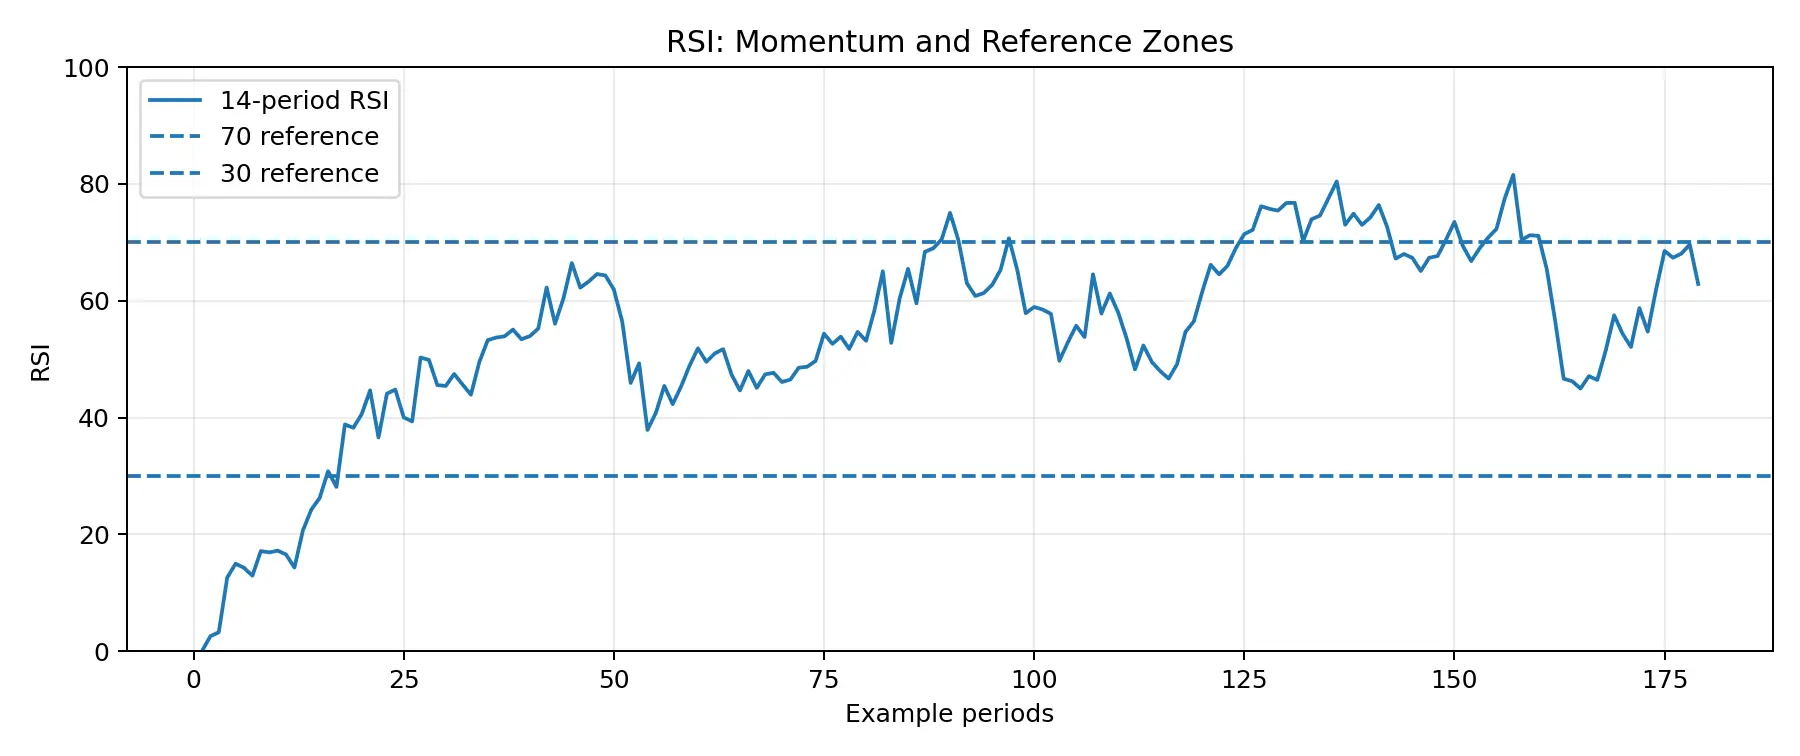
RSI is a 0-100 momentum oscillator based on average gains and losses over a lookback period, commonly 14 periods.
How to Interpret RSI Signals
Above 70 is commonly labelled overbought and below 30 oversold, but those conditions can persist. RSI failure swings, trend ranges and divergence often provide more useful information than a simple threshold touch.
RSI Trading Strategies
Range traders may look for reversals from extremes near support/resistance. Trend traders may use RSI pullbacks to identify momentum resets or use the 50 area as a trend-strength reference. A separate Arslan Ali Markets RSI guide will cover these setups in depth.
29. Force Index
Overview of the Force Index
Force Index combines price change and volume to estimate the force behind a move. A simplified form multiplies the change in closing price by volume.
Force Index ≈ (Current Close – Previous Close) × Volume
How to Use Force Index for Market Strength Analysis
Positive readings suggest upward price force; negative readings suggest downward force. Smoothing with an EMA can help separate short-term spikes from broader pressure.
Force Index Trading Strategies
In spot forex, there is no single centralised global volume feed, so many platforms use tick volume. That means Force Index can still be used as a provider-specific participation proxy, but it should not be presented as total global FX volume.
30. Williams’ Percent Range (%R)
Explanation of Williams %R
Williams %R measures where the current close sits within the recent high-low range and normally moves between 0 and -100. It is mathematically related to the Stochastic Oscillator.
Using %R for Overbought and Oversold Conditions
Readings near 0 indicate price is close to the top of the recent range; readings near -100 indicate price is near the bottom. -20 and -80 are common reference zones.
Williams %R Trading Strategies
As with Stochastic, trend context matters. In a strong uptrend, %R can remain overbought. A useful trend strategy can wait for %R to reset lower during a pullback and then recover as price resumes the trend.
31. The McClellan Oscillator
Introduction to the McClellan Oscillator
The McClellan Oscillator is a market-breadth indicator traditionally calculated from the difference between advancing and declining securities, smoothed with two exponential averages. It is primarily designed for stock-market breadth, not for a single forex pair.
How to Interpret McClellan Oscillator Signals
Positive readings indicate stronger advancing breadth; negative readings indicate stronger declining breadth. Divergence between an equity index and breadth can warn that the index move is losing participation.
Using McClellan for Market Breadth Analysis in a Forex Context
Because spot forex does not have a central universe of “advancing vs declining issues,” McClellan should not be treated as a standard EUR/USD indicator. Forex traders may use equity breadth as an intermarket risk-sentiment input when analysing risk-sensitive currencies, but this is an indirect use. This limitation is important enough to state explicitly rather than forcing the tool into forex.
32. Best Time Frames for Trading
Overview of Different Time Frames
Common chart intervals range from one minute to monthly charts. Lower timeframes contain more price noise and transaction-cost sensitivity; higher timeframes provide cleaner structure but fewer setups.
How to Choose the Best Time Frame for Your Trading Style
| Trading style | Common analysis timeframes | Typical holding period |
|---|---|---|
| Scalping | 1m-15m with higher-timeframe context | Seconds to minutes |
| Day trading | 5m-1H, with 4H/daily context | Minutes to hours |
| Swing trading | 1H-4H with daily/weekly context | Days to weeks |
| Position trading | Daily-weekly-monthly | Weeks to months or longer |
Combining Multiple Time Frames for Effective Analysis
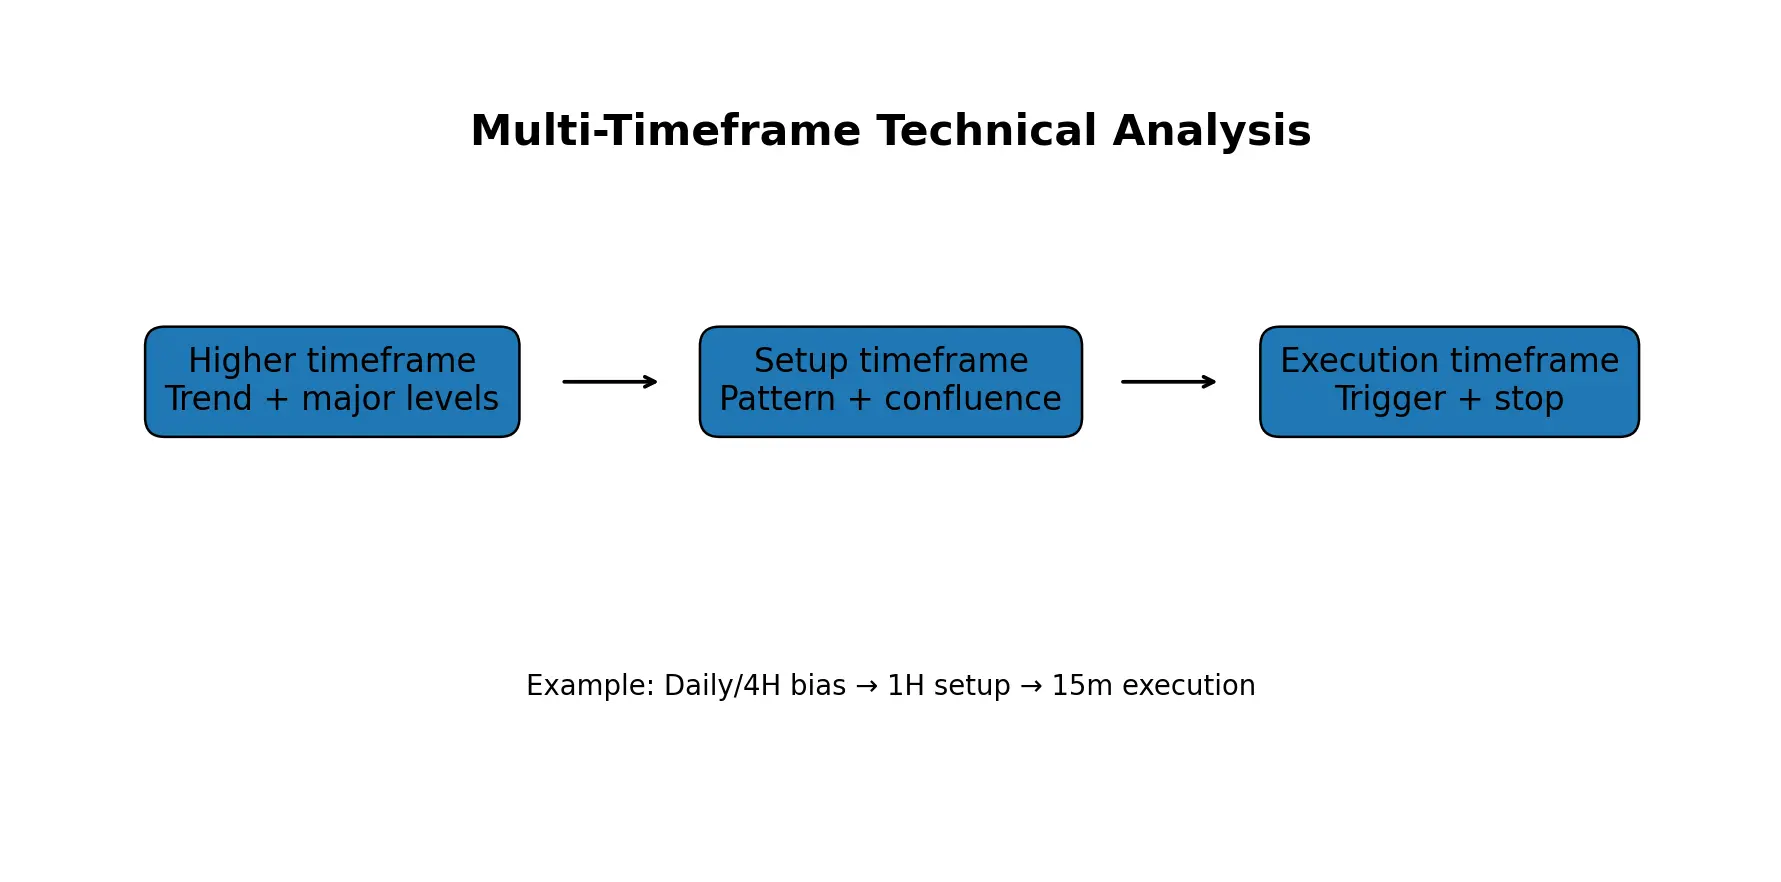
A simple approach is Daily/4H for the main direction, 1H for the setup and 15m for execution. The exact combination should fit the holding period; lower timeframes should refine the trade rather than contradict the larger structure without a clear reason.
Putting the Indicators Together: A Practical Technical Analysis Process
Identify the higher-timeframe trend or range.
Mark major support, resistance and prior breakout zones.
Choose the chart type that fits the job – candlesticks for execution, Heikin-Ashi/Renko as optional trend filters.
Use one trend tool, such as moving averages or ADX.
Use one momentum tool, such as RSI, MACD or Stochastic.
Check volatility with ATR, standard deviation or Bollinger Bands.
Use pivot/Fibonacci/pattern levels only when they align with price structure.
Check the economic calendar before trusting a technical setup around major news.
Define invalidation and calculate position size before entry.
Review the setup afterward and record which part of the analysis added value.
Once this workflow is clear, the advanced forex and CFD strategy guide shows how the same tools can support trend, breakout, pullback and range-based approaches.
Key Limitations of Technical Analysis
Indicators lag
Most indicators are calculated from past price and therefore respond after price has moved.
Signals can conflict
Trend, momentum and volatility tools can disagree because they measure different things.
Ranges create whipsaws
Trend-following indicators often perform poorly when price is directionless.
News can override charts
Central-bank decisions, inflation data and geopolitical shocks can invalidate technical structures quickly.
Volume is imperfect in spot FX
Retail platforms often use tick volume because there is no single global centralised forex volume feed.
Alternative charts transform data
Heikin-Ashi and Renko simplify price action but do not display raw time-price data in the same way as traditional candlesticks.
Backtesting can overfit
A strategy can look excellent after settings are optimised to past data but fail out of sample.
Frequently Asked Questions
What is forex technical analysis?
It is the study of price charts, trends, support/resistance, momentum, volatility and technical indicators to create trading scenarios and define risk levels.
How do you start technical analysis in forex?
Begin with the higher-timeframe trend and major support/resistance. Then choose a setup timeframe, add only the indicators you need, and define invalidation before entering.
Which forex indicators are best?
There is no universal best indicator. Trend tools such as moving averages or ADX, momentum tools such as RSI/MACD and volatility tools such as ATR answer different questions.
Are pivot points useful in forex?
They are widely used intraday reference levels, particularly when combined with actual price reaction and session context. The level itself does not guarantee a reversal or breakout.
Is Heikin-Ashi better than candlesticks?
It is better for smoothing trends, but worse for exact market-price information because the candles are transformed. Many traders use Heikin-Ashi for trend context and standard candles for execution.
Do Renko charts work for forex?
They can help filter noise and show price trends, but brick size matters and the chart removes time information. Use the actual market price for order placement.
Does ZigZag repaint?
The most recent ZigZag swing can change until a sufficient reversal confirms the next leg, so it should be used for structure analysis rather than as a live entry signal.
What ADX reading shows a strong trend?
20-25 are common reference thresholds, but they are not universal. Rising ADX with clear price structure is generally more useful than one fixed number.
Is ATR a buy or sell indicator?
No. ATR measures volatility, not direction. It is useful for stop distance, position sizing and understanding whether market movement is expanding or contracting.
Is the McClellan Oscillator a forex indicator?
Not directly. It is an equity-market breadth indicator based on advancing and declining issues. Forex traders may use it indirectly as an intermarket sentiment input, but not as a standard single-pair oscillator.
Which timeframe is best for forex technical analysis?
The best timeframe depends on the holding period. Multi-timeframe analysis is usually more robust than relying on one interval alone.
Can technical analysis predict forex prices?
No. It helps structure probabilities and define trade scenarios; it cannot guarantee what price will do next.
Conclusion
Recap of the Key Points
Technical analysis is not one indicator. It is a framework that combines price structure, trends, support/resistance, chart types, momentum, volatility, patterns and multiple timeframes. Indicators work best when each has a defined job and when price structure remains the foundation.
Continuous Learning and Practice
The fastest way to improve is to practise on historical charts and demo environments, keep screenshots, document the setup and review whether the tool actually improved the decision. Avoid changing methods after only a handful of trades.
Explore the Individual Indicator Guides
Arslan Ali Markets at AAFX.IO is building dedicated guides for RSI, Stochastic RSI, Bollinger Bands, Fibonacci, moving averages, support/resistance, candlestick patterns, Williams %R, Dow Theory, Momentum, chart patterns and other tools. Use this pillar as the map, then move into the individual articles for detailed setups, settings and examples.
Call to Action
Continue through the Arslan Ali Markets technical-analysis learning path at AAFX.IO, built around Arslan Ali Butt’s market-analysis and trading education. Start with the indicator or chart concept you use most often, test it on historical data, and add it to your trading process only when you can explain exactly what it measures and when it fails.
Risk Warning
Forex and leveraged derivatives involve substantial risk. Indicators and chart patterns can produce false signals, and news, gaps, spreads and slippage can invalidate technical setups. This material is educational and does not constitute personalised financial advice.
Sources & Methodology
Primary-source standard: Market-moving facts should link to original data releases, regulator notices, company filings or official project announcements whenever available. Secondary reporting is used for additional context, not as a substitute for original evidence.
Page last reviewed: