
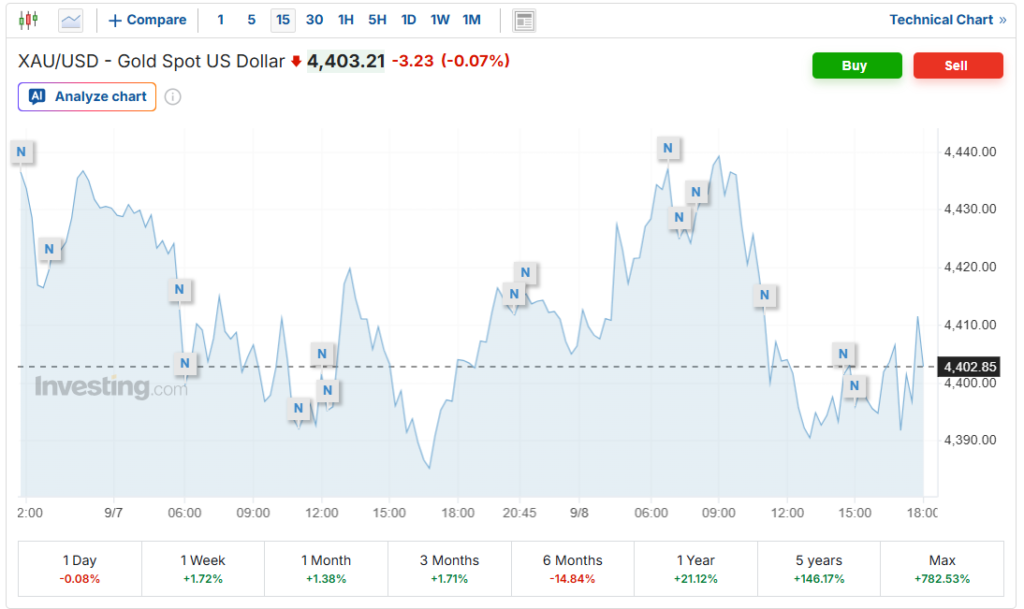
Gold is holding around $4,451.79 on the five-hour chart, with the precious metal testing a crucial 38.2% Fibonacci retracement level. The setup reflects a tense battle between buyers defending support and sellers attempting to extend the recent decline.
The current structure places gold near the lower edge of the Ichimoku cloud, adding importance to the $4,451 area. Fibonacci retracement levels are commonly used to identify potential support and resistance, but they are not definitive reversal points and are generally more useful when confirmed by momentum, volume and price patterns.
The main technical risk is a sustained five-hour close below $4,355. Such a move would break the highlighted support structure and could increase the probability of a deeper bearish reversal.
For now, buyers still have an opportunity to defend the support zone and push gold back toward the nearby resistance cluster.
MACD improves as bears stay active
Momentum indicators are sending mixed signals. The MACD has produced a positive crossover, with the MACD reading at -13.39 versus -15.22 for the signal line. This suggests that short-term buying momentum may be starting to improve.
However, the broader setup remains vulnerable. The ADX stands at 31.12, pointing to meaningful trend strength, while a fresh Bearish Engulfing candlestick indicates that sellers have recently rejected higher prices.
Overhead resistance remains concentrated around several technical levels:
- $4,489.64: SuperTrend resistance.
- $4,495: Key upside breakout trigger.
- $4,531.07: 50-period moving average.
- $4,545-$4,546: Bearish-thesis invalidation zone.
Fading volume also suggests that breakout participation is limited. As a result, gold could remain range-bound until a stronger catalyst produces a decisive move.
$4,355 remains the bearish trigger
The technical setup leaves gold caught between competing signals. A bullish move would become more convincing if the $4,447-$4,449 support area continues to hold and price subsequently breaks above $4,495.
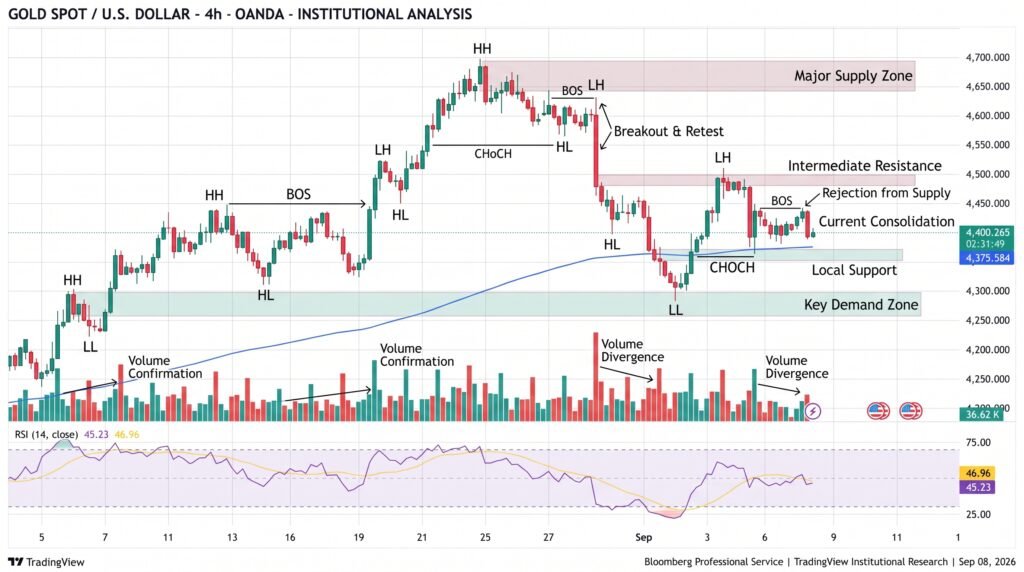
GOLD Price Chart – Source: Tradingview
A move through $4,495 would place the SuperTrend near $4,489.64 under pressure, but bulls would still face the $4,531.07 50-period moving average before establishing stronger short-term control.
On the downside, a break below $4,355 would materially weaken the current structure. The next major technical reference is the 200-period SMA near $4,323, which also represents the source chart’s bullish-thesis invalidation level.
The $4,400-$4,489 area remains a choppy zone where directional signals can be unreliable. A confirmed breakout would provide a clearer indication of the next trend.
Conclusion
Gold remains locked in a critical technical battle around $4,451, where the 38.2% Fibonacci retracement and the Ichimoku cloud are providing immediate support. The positive MACD crossover offers a potential bullish signal, but the strong ADX and Bearish Engulfing candle show that sellers remain active. A move above $4,495 would strengthen the recovery case, while a break below $4,355 could accelerate losses toward $4,323. Until either level breaks decisively, gold remains vulnerable to further choppy trading.
Sources & Methodology
Primary-source standard: Market-moving facts should link to original data releases, regulator notices, company filings or official project announcements whenever available. Secondary reporting is used for additional context, not as a substitute for original evidence.
Page last reviewed: