
In the fast-moving world of CFD trading, building advanced skills is essential if you want to capitalize on market opportunities. This guide, which I’ve written for educational purposes on AAFX, explores the deeper side of CFD trading strategies. I’ll walk you through advanced technical tools such as Fibonacci Retracement, Ichimoku Cloud, and oscillator trading, while also touching on algorithmic and high-frequency trading—key components of an advanced CFD strategy suitable for experienced traders.
Beyond technical setups, I’ll explain how sentiment analysis—tracking market mood through economic news, data releases, and even social media—can play a vital role in shaping your trading decisions. News trading, an event-driven approach that leverages economic news and data releases to make rapid trading decisions, will also be introduced as part of these advanced strategies.
This content is designed for traders who want to refine their approach, strengthen their discipline, and understand the strategies that professionals often rely on. My goal with AAFX is simple: to make advanced trading education accessible, practical, and easy to apply, whether you’re trading Forex, indices, or CFDs.
Introduction to CFD Trading
CFD trading, or Contract for Difference trading, is a flexible way for traders to participate in the financial markets without actually owning the underlying asset. Instead of purchasing shares, commodities, or currencies outright, CFD traders speculate on the price movements of a wide range of financial instruments. This means you can potentially profit whether the market price rises or falls, as long as your market analysis and trading strategies are sound.
One of the main attractions of CFD trading is the ability to access global markets and diverse asset classes from a single trading platform. Whether you’re interested in stocks, indices, commodities, or forex, CFDs allow you to trade them all with the same approach. However, success in CFD trading requires more than just picking the right direction. It’s essential to develop effective CFD trading strategies that incorporate thorough market analysis, clear trading objectives, and robust risk management practices.
By focusing on these core elements, CFD traders can make more informed decisions, manage their exposure to risk, and adapt to changing market conditions. Ultimately, the goal is to capitalize on price movements while protecting your trading capital—making CFD trading a dynamic and strategic way to engage with the world’s financial instruments.
Leveraging Advanced Technical Analysis
When traders move beyond the basics, technical analysis becomes more than just spotting trends — it turns into a toolkit for precision and discipline. On AAFX, I share some of the advanced methods I personally use and teach for educational purposes. These advanced technical analysis tools are valuable for allowing traders to develop, analyze, and refine their strategies. These tools can help you recognize market structure, refine entries and exits, and develop a stronger sense of timing.
Here are five of the most effective techniques:
- Pivot Points – Calculated from the previous day’s high, low, and close, pivot points help traders predict potential support and resistance zones. They act as signposts for whether the market may lean bullish (above the pivot) or bearish (below the pivot).
- Fibonacci Retracement – Based on mathematical ratios, Fibonacci levels highlight areas where price could pause or reverse. Many traders look to the 38.2%, 50%, and 61.8% retracement zones as decision-making levels.
- Moving Averages (SMA & EMA) – Moving averages smooth out price action, making trends easier to spot. The EMA (Exponential Moving Average) responds faster to price changes, while the SMA (Simple Moving Average) gives a more balanced view.
- Oscillators (RSI & MACD) – These momentum tools signal overbought or oversold conditions. RSI measures speed of price movement, while MACD helps identify potential trend reversals by comparing moving averages.
- Ichimoku Cloud – A multi-layered system that combines trend direction, support/resistance, and momentum in a single view. It’s especially useful for traders who want both a snapshot of market sentiment and detailed trade signals.
Each of these techniques has its strengths, but they work best when combined thoughtfully. On AAFX, I share these strategies as educational resources so traders can experiment, test, and build confidence in applying them to live markets. Using historical data to back-test and validate these advanced techniques is essential for understanding their effectiveness and improving trading performance.
Pivot Points: A Simplified Forex Trading Strategy
Among the most popular CFD trading strategies, pivot points remain a cornerstone for experienced traders. They provide a structured way to analyze market conditions and identify potential support and resistance levels, including key support areas that can act as a floor for price action. This makes them particularly effective for both swing trading and intraday trades.
A pivot point is calculated using the previous day’s high, low, and closing market price. Trading above the pivot point is generally seen as bullish, while trading below it signals bearish momentum. This allows CFD traders to make more informed trading decisions about possible price movements. Using pivot points as part of a cfd strategy helps manage risk and identify trading opportunities in dynamic markets.
Pivot Point Formula
Pivot Point Calculation:
- Pivot Point (PP): (High + Low + Close) / 3
- First Level Support and Resistance:
- First Resistance (R1): (2 x PP) – Low
- First Support (S1): (2 x PP) – High
- Second Level Support and Resistance:
- Second Resistance (R2): PP + (High – Low)
- Second Support (S2): PP – (High – Low)
- Third Level Support and Resistance:
- Third Resistance (R3): High + 2(PP – Low)
- Third Support (S3): Low – 2(High – PP)
Why They Matter in CFD Trading
For traders analyzing financial markets, pivot points act like signposts that highlight potential market movements. They’re especially useful in volatile markets where price fluctuations can quickly create new trading opportunities and present trading opportunities, especially when economic data releases or sudden market volatility lead to significant price moves.
In practice, many CFD strategies combine pivot points with candlestick chart analysis or other indicators like the Relative Strength Index (RSI) and Moving Average Convergence Divergence (MACD). This multi-layered market analysis helps refine entry and exit points while improving the risk-to-reward ratio.
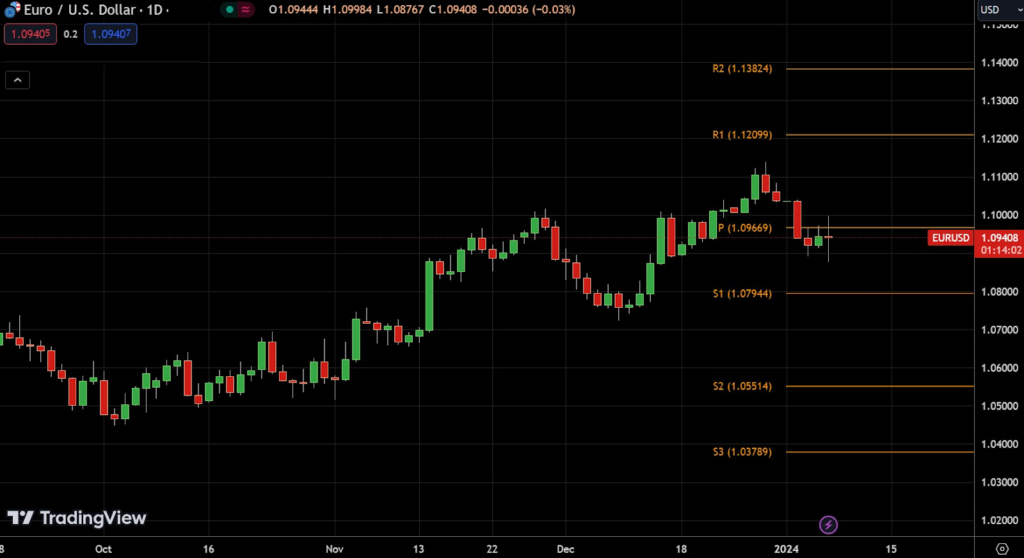
Let’s look at a simplified CFD trading strategy using pivot points as shown on the EUR/USD chart. These levels act like reference markers, guiding traders toward potential entry and exit points while helping manage trading risks.
- Observing the Pivot Point: The central line labeled P (1.09669) is the middle ground. If the market price holds above this level, it often signals bullish momentum. If it trades below, the market may lean bearish.
- Buying Strategy: When the price dips toward S1 (1.07944) and then rebounds, it’s similar to a ball bouncing off the floor. This could present a trading opportunity to go long, expecting the market to rise. Such scenarios often present trading opportunities for traders looking to capitalize on short-term price movements.
- Selling Strategy: If price approaches R1 (1.12099) but fails to break through and reverses lower, it’s like hitting a ceiling. That may be a good moment to sell, anticipating a retracement.
- Setting a Safety Net (Risk Management): Always manage risk with a stop-loss. For example, if buying at S1, a stop-loss just below that support level helps protect your trading capital if the market experiences price breaks below key support, signaling a potential trend reversal or continuation.
- Taking Profit: To secure gains, many CFD traders place profit targets slightly below the next resistance level (R1 in this case). This approach improves the risk-to-reward ratio and ensures profits are realized before the market turns.
Pivot points don’t guarantee outcomes, but they’re a structured way to anticipate potential market movements. In volatile forex markets and other financial instruments, they allow traders to make more informed trading decisions rather than relying on guesswork.
Advanced Indicators: Fibonacci Retracement
One of the most widely used CFD trading strategies by experienced traders is Fibonacci Retracement. Many CFD trading strategies incorporate Fibonacci retracement to adapt to different market conditions and enhance decision-making. This tool is based on the idea that after a strong price move, markets tend to retrace a portion of that move before resuming in the original direction. By plotting Fibonacci levels, traders can anticipate areas of potential support and resistance and refine their entry and exit points.
The most commonly used retracement levels are 23.6%, 38.2%, 50%, 61.8%, and 100%. These levels act like checkpoints on a price chart, helping CFD traders identify where a retracement might pause and present new trading opportunities.
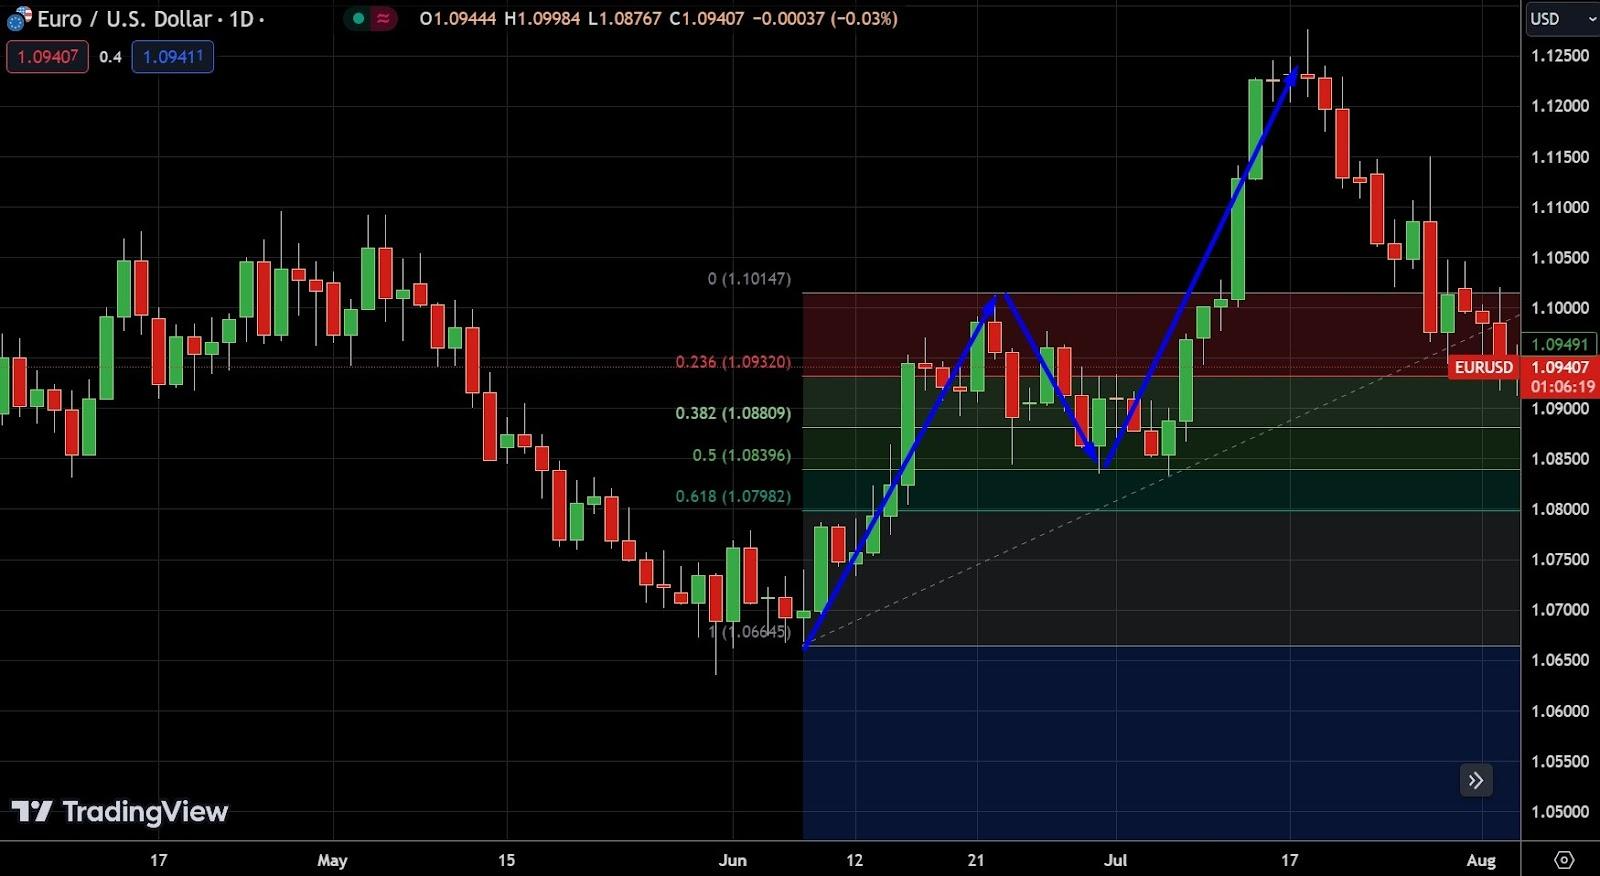
On the EUR/USD daily chart, applying Fibonacci retracement provides a roadmap for understanding price movements and planning informed trading decisions. Here’s a simplified breakdown:
- Identify Major Moves: Start by spotting a strong trend, either a sharp rise or fall. In the example, a major rally was followed by a decline.
- Fibonacci Levels: After marking the high and low of that move, the retracement tool automatically plots horizontal lines at the key Fibonacci ratios. These lines suggest where the market could pause or reverse, helping traders respond to rapid changes in market prices.
- Trading Strategy:
- If the price drops and rebounds near the 50% level (around 1.08396), that may offer a potential buying setup.
- If price climbs and then reverses near a higher level (like 61.8%), it could present a selling opportunity.
- Using Figures: For instance, if EUR/USD approaches 1.07982 (61.8% retracement) and then starts to rise, that can be considered a buying signal.
Why Fibonacci Matters
While Fibonacci levels don’t guarantee outcomes, they provide structure in otherwise volatile markets. Many of the best CFD trading strategies combine Fibonacci with tools like the Relative Strength Index (RSI) or Moving Average Convergence Divergence (MACD) for confirmation.
3. Moving Averages: A Beginner’s Guide by Flowbank
Moving averages are one of the most popular CFD trading strategies for spotting market trends and smoothing out price fluctuations. Moving averages can be applied to any financial instrument, including stocks, forex, and commodities. By averaging past prices over a set period, they filter out short-term noise and give traders a clearer picture of where the financial markets may be heading. However, frequent trading based on moving average signals can increase trading costs, which traders should consider when developing their strategies.
Types of Moving Averages
- Simple Moving Average (SMA): Gives equal weight to each day’s price over the chosen period. This makes it a steady measure but slower to react to sudden price moves.
- Exponential Moving Average (EMA): Places more weight on recent data, allowing it to respond faster to market volatility and short-term price movements.
The choice of period matters. For example:
- A 50-day moving average is widely used for a medium-term outlook.
- A 200-day moving average is a favorite among seasoned traders for identifying long-term trends.
- Shorter timeframes (5–10 days) are often applied in swing trading or breakout trading strategies to capture short-term trading opportunities.
- Simple Moving Average (SMA): Gives an equal weight to each day’s price over the chosen period.
- Exponential Moving Average (EMA): Puts more emphasis on recent prices, reacting more quickly to price changes.
The “number of days” in a moving average is crucial — a 50-day moving average is common for a medium-term view, while a 200-day moving average might be used for a longer-term outlook.
Shorter periods like 5 or 10 days can offer insights into short-term trends. The key is to choose a period that aligns with your trading strategy without getting caught up in market “noise” or missing significant moves.
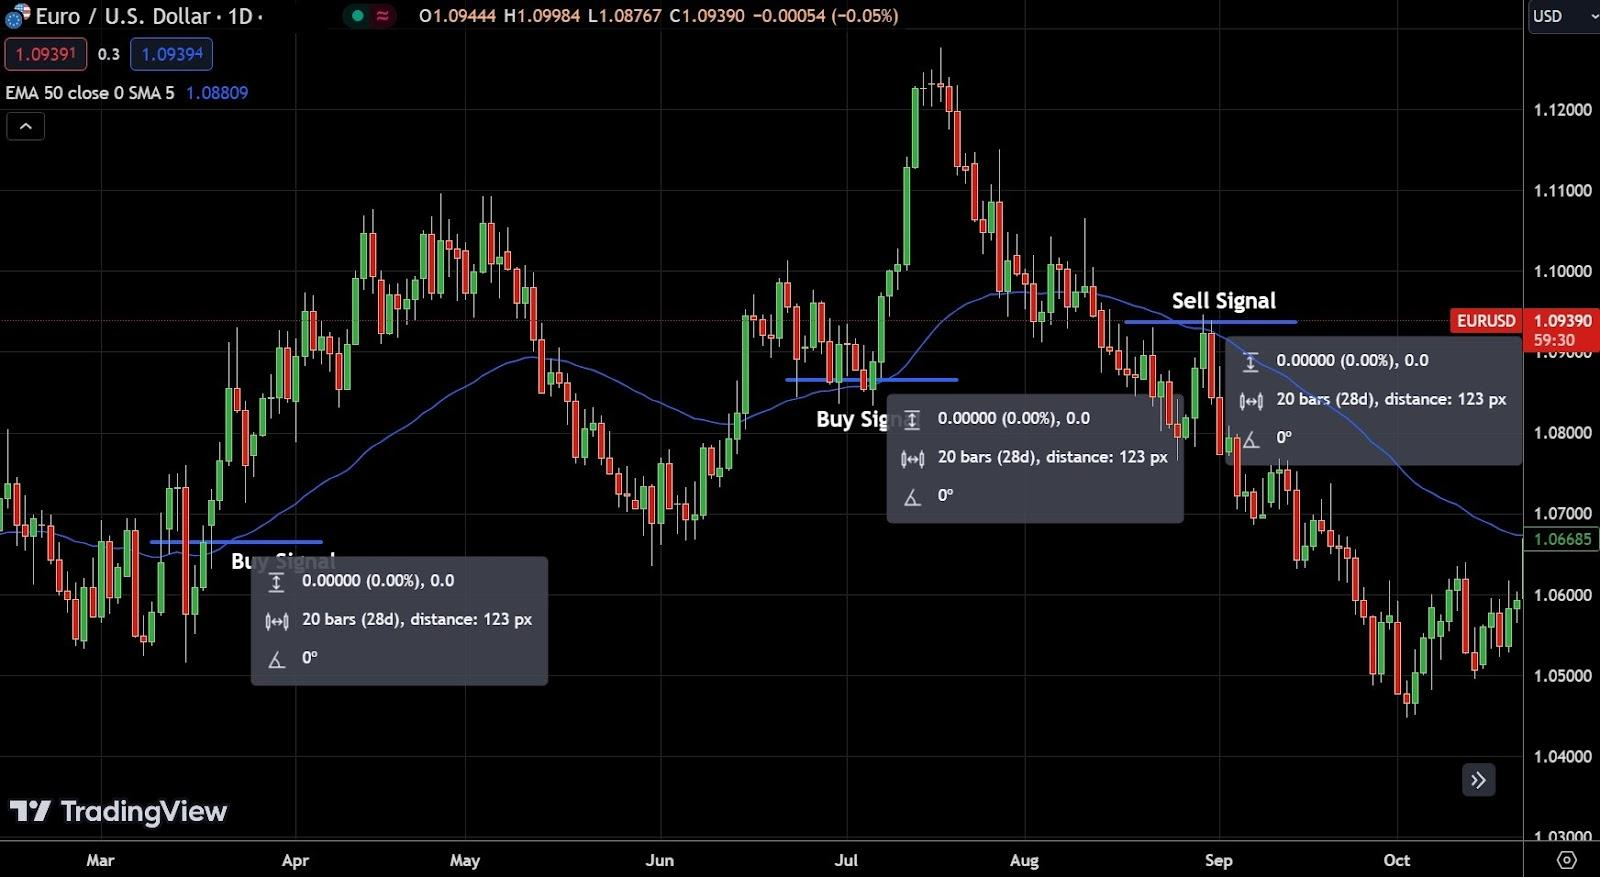
From the Chart: On the EUR/USD chart, the EMA (blue line) reacts closely to recent price movements:
- A Buy Signal appears when price crosses above the EMA (for instance, near 1.08809), suggesting bullish momentum.
- A Sell Signal occurs when price drops below the EMA (like near 1.10685), pointing to possible bearish momentum.
A Simple Strategy
For beginners, think of moving averages as traffic lights for trading decisions:
- Green light (Buy): When price rises above the EMA, it may indicate the start of a new uptrend.
- Red light (Sell): When price falls below the EMA, it can signal a downtrend.
4. Oscillator Trading (RSI and MACD)
Two of the most widely used tools in technical analysis are oscillators — specifically the Relative Strength Index (RSI) and the Moving Average Convergence Divergence (MACD). Both help traders assess market conditions by highlighting momentum, strength, and possible turning points in price movements. Maintaining a trading journal to record oscillator-based trades and reflections can help improve trading discipline and identify patterns for continuous improvement.
Relative Strength Index (RSI)
The RSI measures the speed and magnitude of recent price moves, comparing gains to losses.
- A reading above 70 suggests the market may be overbought, signaling a possible pullback.
- A reading below 30 suggests the market may be oversold, indicating a potential rebound.
This makes RSI a useful guide for identifying entry and exit points during periods of market volatility.
Moving Average Convergence Divergence (MACD)
MACD is built from two exponential moving averages (EMAs) and shows when momentum is shifting.
- A bullish signal appears when the MACD line crosses above the signal line.
- A bearish signal occurs when the MACD line crosses below the signal line.
Because it tracks momentum, MACD helps traders confirm whether a trend is gaining or losing strength.
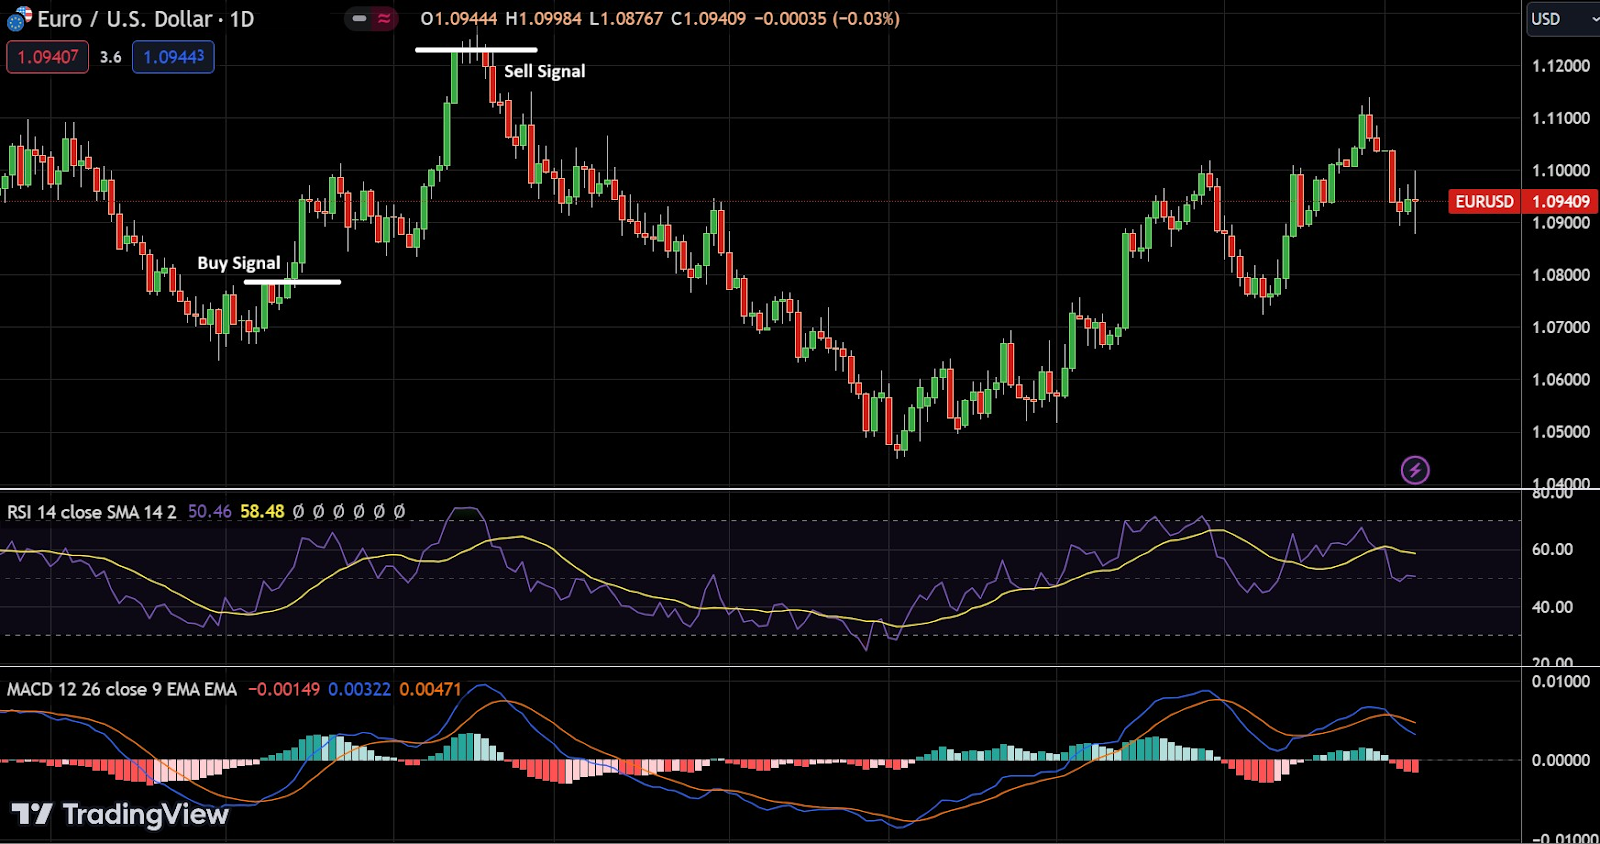
Example: EUR/USD with RSI and MACD
- Buy Setup: If RSI dips near 30 (oversold) and the MACD line crosses above the signal line around 1.08, that combination may indicate a buying opportunity.
- Sell Setup: If RSI rises toward 70 (overbought) while the MACD line crosses below the signal line near 1.12, it could be a signal to sell.
Why Oscillators Matter
Both RSI and MACD give valuable insights into overbought or oversold conditions, improving a trader’s ability to anticipate potential market movements. Still, they’re not foolproof. Oscillators should always be used as part of a broader CFD trading strategy that includes risk management, monitoring of economic indicators, and a structured trading plan.
On AAFX, I include these tools in my educational content because they show traders how to spot trading opportunities in both rising and falling markets, while managing risk more effectively. Oscillators can also help traders manage multiple positions by providing clear signals across different assets, making it easier to balance and monitor several trades at once.
Ichimoku Cloud (Ichimoku Kinko Hyo)
The Ichimoku Cloud — or Ichimoku Kinko Hyo — is one of the most versatile indicators in technical analysis. Unlike single-line indicators, it provides a holistic view of market dynamics, showing trend direction, support and resistance levels, and momentum all in one glance. It is also highly effective for range trading in sideways markets, helping traders identify key support and resistance zones for entry points and risk management. This makes it especially valuable in volatile markets and is widely used in the stock market where price direction can shift quickly.
Key Components of the Ichimoku Cloud
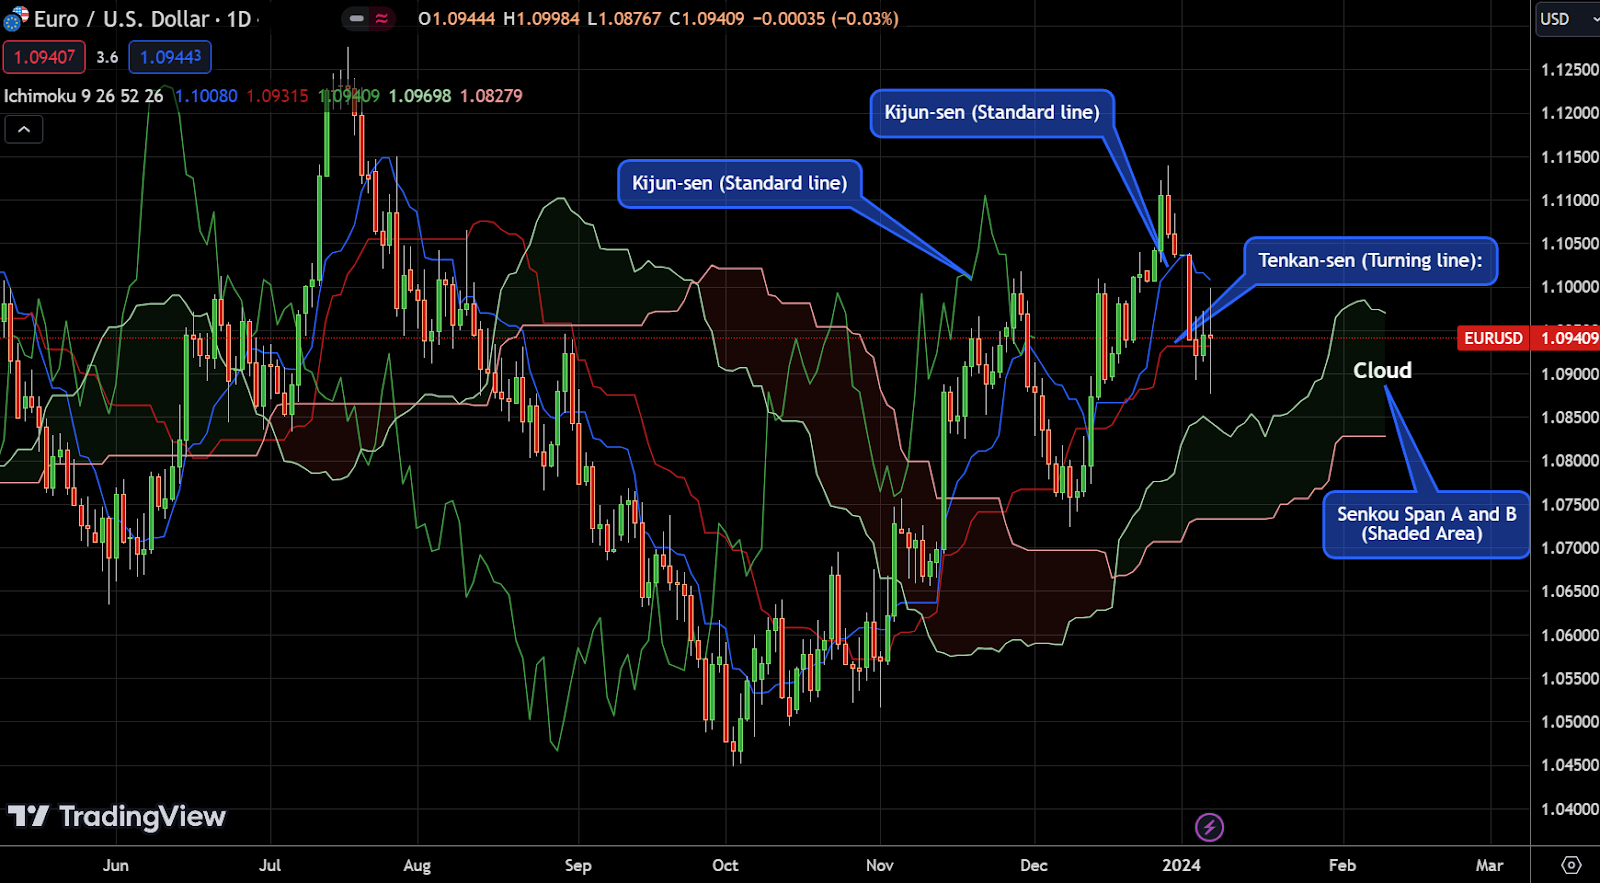
- Senkou Span A & B (The Cloud): These two lines form the shaded “cloud.” When price is above the cloud, it signals bullish momentum; below the cloud, it often signals weakness. For example, a light green cloud between 1.0969 and 1.0827 illustrates support/resistance zones and overall market sentiment.
- Tenkan-sen (Turning Line): A short-term measure (9 periods) that shows immediate momentum. If the current market price is above this line (e.g., EUR/USD at 1.0940 vs. Tenkan-sen at 1.0931), it can suggest buying interest.
- Kijun-sen (Standard Line): A medium-term trend line (26 periods). If price is above it, the outlook leans bullish; below it, bearish. For example, if EUR/USD trades at 1.0940 while the Kijun-sen holds at 1.0080, it signals a potential sell bias.
- Chikou Span (Lagging Line): Plotted 26 periods behind, it compares current momentum to past price movements. If Chikou Span sits above price from 26 periods ago, it’s a bullish sign; if below, bearish.
Trading Strategies with Ichimoku Cloud
Trading Strategies with Ichimoku Cloud
Bullish Signal: When price rises above the cloud and the cloud itself is green, it suggests a strong uptrend. Traders may look to enter long positions once price closes above all key Ichimoku lines. For instance, EUR/USD breaking above 1.10500 could indicate strength.
Bearish Signal: When price drops below the red cloud, it points to potential weakness. A short entry may be considered if EUR/USD falls below the cloud near 1.0800.
Why It MattersThe Ichimoku Cloud stands out because it doesn’t just highlight price fluctuations — it reflects the balance of buyers and sellers, helping traders anticipate potential market movements before they occur. Many CFD traders combine Ichimoku signals with tools like RSI or Fibonacci to refine entry and exit points and improve risk-to-reward ratios.
Fundamental Analysis for CFDs
Fundamental analysis is a cornerstone of successful CFD trading, providing traders with a deeper understanding of the factors that drive price movements in the financial markets. Unlike technical analysis, which focuses on chart patterns and historical price data, fundamental analysis examines the underlying economic and financial conditions that influence a financial instrument’s value.
For CFD traders, this means analyzing a range of economic indicators—such as GDP growth, inflation rates, employment figures, and central bank policies—as well as company-specific data like earnings reports, revenue growth, and industry trends. By evaluating these factors, traders can anticipate how news events or shifts in economic conditions might impact asset prices and identify trading opportunities before they appear on the charts.
Combining fundamental analysis with technical analysis allows CFD traders to form a more comprehensive view of the market. This integrated approach leads to more informed trading decisions, helping traders pinpoint potential entry and exit points and manage risk more effectively. In fast-moving markets, understanding the fundamental drivers behind price movements can give you a valuable edge and help you stay ahead of potential market shifts.
Algorithmic Trading in CFD Markets
Algorithmic trading has become an increasingly popular approach in CFD trading, especially among traders looking to implement advanced CFD trading strategies with speed and precision. By using computer programs to automatically execute trades based on predefined rules, algorithmic trading allows traders to take advantage of market opportunities that might be missed by manual trading.
In CFD markets, algorithmic trading can be used to automate a variety of trading strategies, from trend following to mean reversion and even more complex approaches that analyze multiple market variables simultaneously. These algorithms can scan the markets for trading signals, execute trades at optimal prices, and manage positions around the clock—all while adhering to strict risk management parameters.
However, successful algorithmic trading requires more than just a good strategy. Traders need a solid understanding of programming languages, familiarity with trading platforms, and a commitment to ongoing testing and optimization. Most importantly, robust risk management is essential to protect against unexpected market moves and system errors. When used correctly, algorithmic trading can help CFD traders execute advanced strategies efficiently and consistently in today’s fast-paced financial markets.
Risk Management in Advanced CFD Trading
Risk management is at the heart of every advanced CFD trading strategy. In the world of CFD trading, where leverage can amplify both profits and losses, having a clear plan for managing risk is essential for long-term success. Effective risk management starts with setting stop-loss orders to limit potential losses on each trade and carefully controlling position sizes to avoid overexposure to any single market move.
Diversification is another key element, allowing CFD traders to spread their risk across different asset classes and market sectors. This approach helps cushion the impact of market volatility and unexpected price movements, especially in falling markets. It’s also important to regularly review and adjust your trading plans to ensure they remain aligned with your trading objectives and the current market conditions.
Sound risk management isn’t just about protecting your trading capital—it’s about creating a disciplined framework that supports consistent decision-making in both rising and falling markets. By prioritizing risk management, advanced CFD traders can navigate market volatility with greater confidence, adapt to changing conditions, and maximize their potential for long-term returns.
Conclusion: Building Stronger Trading Strategies with Technical Analysis
Mastering tools like pivot points, Fibonacci retracement, moving averages, RSI, MACD, and the Ichimoku Cloud gives traders a powerful edge in navigating financial markets. Each indicator highlights different aspects of market dynamics — from support and resistance levels to momentum, trend direction, and potential entry and exit points. These technical tools are especially valuable for position trading, a medium- to long-term strategy that relies on identifying strong market trends and fundamentals to hold positions for weeks or even months.
No single indicator guarantees success. But when combined within a structured trading plan, supported by sound risk management and a disciplined approach, they form the backbone of many of the best CFD trading strategies.
On AAFX, I share these insights for educational purposes so that traders can understand how technical tools work, how to apply them in rising and falling markets, and how to make more informed trading decisions in volatile markets.
The ultimate goal is not just about spotting the next move — it’s about developing a consistent process that helps you manage risk, refine your trading objectives, and adapt to changing market conditions.
Frequently Asked Questions (FAQ)
1. What are the best CFD trading strategies for beginners?
For new CFD traders, simple methods like moving averages and pivot points are often the easiest starting point. They help identify market trends and potential support and resistance levels without being overly complex.
2. How do oscillators like RSI and MACD help traders?
The Relative Strength Index (RSI) shows when markets may be overbought or oversold, while the Moving Average Convergence Divergence (MACD) highlights momentum shifts. Together, they help confirm entry and exit points.
3. Is Fibonacci retracement reliable in CFD trading?
Fibonacci retracement levels (23.6%, 38.2%, 50%, 61.8%) provide reference zones where price movements often pause or reverse. While not perfect, they’re widely used to anticipate potential market movements.
4. How can I manage risk when trading CFDs?
Successful CFD trading isn’t just about spotting trading opportunities — it’s also about managing risk. Always use stop-loss orders, calculate your risk-to-reward ratio, and never risk more trading capital than you can afford to lose.
5. Can I trade CFDs without owning the underlying asset?
Yes. CFDs allow traders to speculate on asset prices in rising and falling markets without owning the underlying asset. This flexibility is one reason CFDs are popular across forex markets, stock markets, and global financial markets.
6. What are the tax implications and costs of a CFD trade?
A CFD trade may have specific tax implications depending on your country’s regulations. Additionally, holding a CFD position long-term can incur costs such as overnight financing fees. It’s important to consider these financial aspects before entering a CFD trade.
