
Pi Network is extending its decline below $0.090, with PI falling for a fifth consecutive session on Monday. The token is trading around $0.0865, leaving the market increasingly focused on whether buyers can defend the next major support levels.
The decline comes despite relatively firm activity in PI futures, where Open Interest (OI) stands at approximately $10.15 million, up from $9.78 million a day earlier. Higher OI means more derivatives contracts remain open, but it does not reveal whether those positions are predominantly bullish or bearish. That distinction is important because rising OI during a falling spot market can leave newly established long positions exposed to further losses.
The broader cryptocurrency market is showing considerably stronger risk appetite. The Crypto Fear & Greed Index recently remained in the greed zone, although the reading has fluctuated during the month.
PI Derivatives Fail to Stop Decline
The increase in PI futures OI provides evidence that traders remain active, but it has not translated into a recovery in the underlying token. The contrast suggests that derivatives participation alone is not enough to reverse the current price trend.
PI’s broader fundamental backdrop is also still developing. Pi Network has continued releasing updates covering KYC, Mainnet migration and developer infrastructure, including improvements intended to resolve migration bottlenecks and expand development capabilities.
For traders, however, the immediate issue remains price structure. Unless PI can reclaim nearby moving-average resistance, derivatives positioning could remain vulnerable to another wave of selling.
$0.0827 Support Is the Key Test
The technical picture remains bearish. PI is capped by its 50-day Exponential Moving Average (EMA) at $0.0911, while the 100-day and 200-day EMAs sit near $0.0991 and $0.1219, respectively. The positioning of these moving averages reinforces the longer-term downward structure.
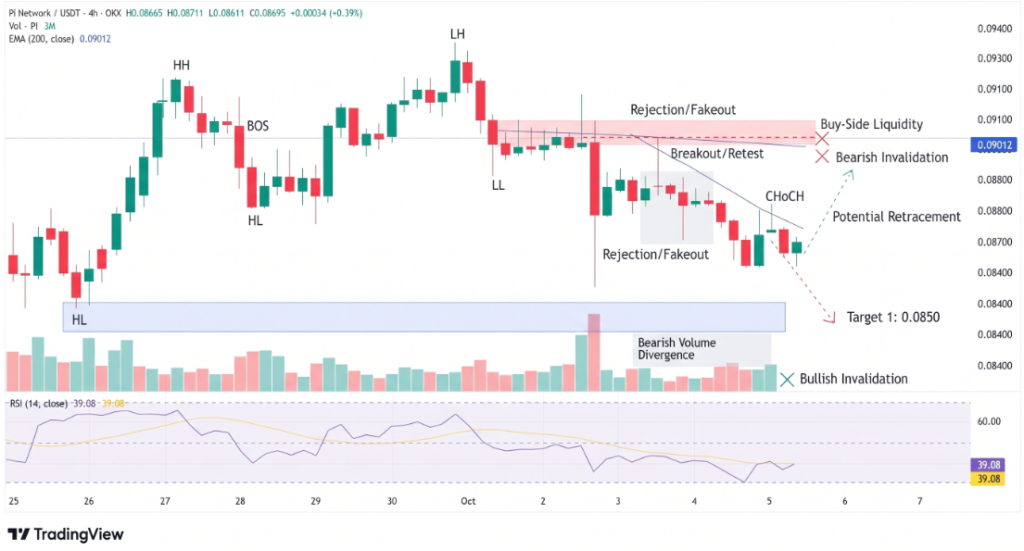
Momentum indicators also favor sellers. The Relative Strength Index (RSI) has fallen to 43, below its midpoint, while the MACD remains slightly negative. Neither indicator currently provides a strong reversal signal.
The next major technical area is the 23.6% Fibonacci retracement at $0.0827, calculated from $0.1341 to $0.0704. The July 31 low near $0.0801 strengthens that support zone.
Key levels for PI traders include:
- $0.0911: 50-day EMA and first resistance.
- $0.0990–$0.0991: Fibonacci and 100-day EMA resistance.
- $0.0827: Immediate Fibonacci support.
- $0.0801: July 31 low.
- $0.0704: Major swing-low risk.
A decisive break below $0.0827 and $0.0801 would expose the $0.0704 swing low and confirm a deeper bearish leg. Conversely, reclaiming $0.0911 would be the first indication that selling pressure is easing, while a move above $0.0991 would provide stronger evidence of a broader recovery.
Conclusion
PI remains under pressure despite a modest increase in futures Open Interest. The token’s fifth consecutive daily decline, negative MACD and RSI below 50 keep the short-term bias bearish. $0.0827 is now the critical support, with $0.0801 and $0.0704 below it. A break beneath this zone could accelerate losses, while recovery above $0.0911 would be the first meaningful signal that buyers are regaining control.
Sources & Methodology
Primary-source standard: Market-moving facts should link to original data releases, regulator notices, company filings or official project announcements whenever available. Secondary reporting is used for additional context, not as a substitute for original evidence.
Page last reviewed: