
The US Dollar Index (DXY) climbed to 102.53 on Monday, marking its highest level since April 2025, before easing toward 102.20. The index remains technically constructive as the dollar trades above its nine-day and 50-day exponential moving averages (EMAs). However, momentum is becoming stretched. The 14-day Relative Strength Index (RSI) stands at 76.30, firmly above the 70 threshold commonly associated with overbought conditions.
DXY Holds Bullish Structure
The dollar’s latest advance has been driven partly by weakness in the euro, which carries the largest weighting in the DXY basket. The euro fell to a 17-month low as concerns over France’s fiscal position and political uncertainty pressured European assets. That relative weakness has helped push the US Dollar index higher even as expectations for an October Federal Reserve rate increase have declined.
From a technical perspective, the DXY remains above its short- and medium-term trend averages. The nine-day EMA is positioned above the 50-day EMA, maintaining a positive trend structure.
The broader daily chart, however, shows the index advancing inside an ascending wedge. Such a pattern can support further gains while price remains inside its boundaries, but a decisive break below the lower trend line would increase the probability of a deeper correction.
The Federal Reserve raised its policy rate by 25 basis points in September to a target range of 3.75%-4.00%, while inflation remained elevated.
102.53 Resistance Meets RSI Risk
The immediate upside reference is the 102.53 high, which currently represents the key resistance level. A sustained break above that peak could reinforce the bullish trend and open the way toward higher levels as traders reassess the dollar’s momentum.
Yet the technical picture is becoming less comfortable for fresh long positions.
- RSI: 76.30, indicating overbought conditions
- Resistance: 102.53
- First support: 101.49
- Major support: 100.30
The elevated RSI does not automatically signal a reversal, but it indicates that the current advance is stretched. The DXY has also remained firm despite softer US employment data, showing that currency markets are responding to broader relative-growth, yield and European fiscal concerns rather than relying solely on Fed interest-rate expectations.
DXY Forecast: Watch 101.49
The first downside test is the nine-day EMA at 101.49, which also sits near the lower boundary of the ascending wedge. Holding above this area would preserve the short-term bullish structure and leave 102.53 vulnerable to another test.
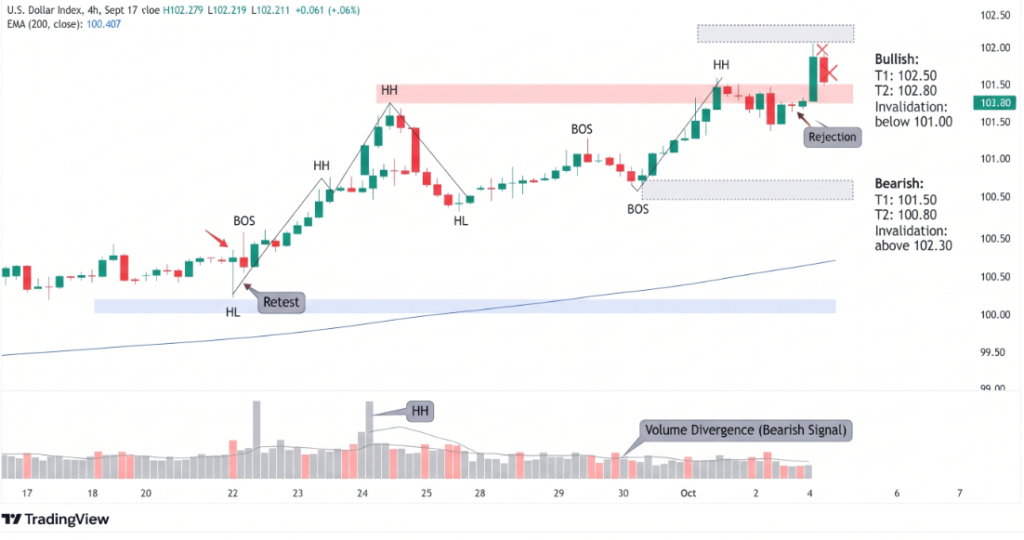
A clear break below the wedge would change the technical picture. In that scenario, the 50-day EMA around 100.30 becomes the next major support zone. A deeper decline could then expose the 98.56 low recorded on August 20.
The balance is therefore shifting between strong trend momentum and increasingly stretched conditions. Unless DXY breaks below its wedge support, buyers retain control; however, a move through 101.49 would provide the first warning that the rally from the August lows is losing momentum.
Conclusion
The US Dollar Index remains bullish after reaching 102.53, but its 76.30 RSI highlights growing correction risk. The 102.53 level is the immediate upside barrier, while 101.49 is the first critical support. A break below that level could accelerate losses toward 100.30 and potentially 98.56. For now, the trend favors dollar bulls, but the risk-reward profile is becoming less favorable as the index approaches overbought territory.
Sources & Methodology
Primary-source standard: Market-moving facts should link to original data releases, regulator notices, company filings or official project announcements whenever available. Secondary reporting is used for additional context, not as a substitute for original evidence.
Page last reviewed: