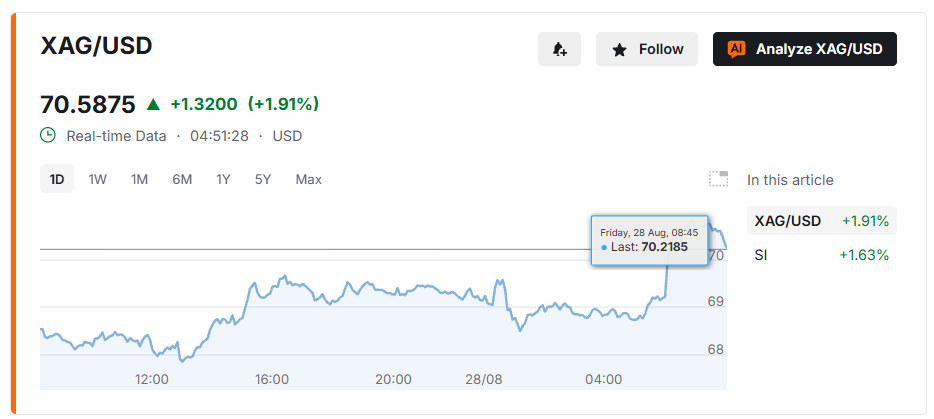
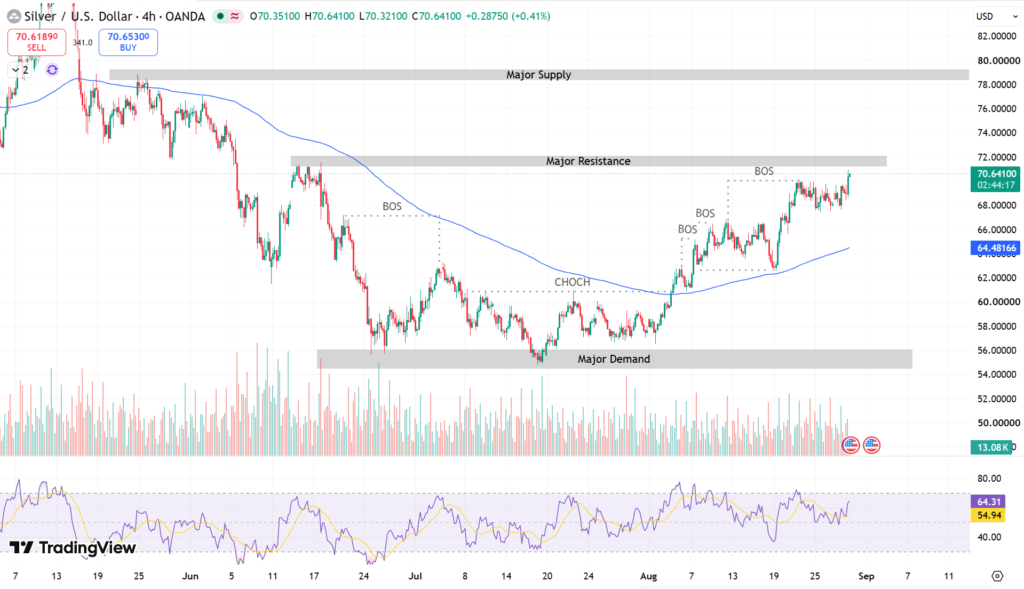
Silver closed a fresh five-hour candle at $70.41, edging just above the closely watched $70.40 resistance level and completing an ascending triangle pattern that is now 95% formed. The breakout arrives after a rally that has already lifted the metal roughly 70% over the past year, well above its 200-period simple moving average of $61.99. But with the MACD histogram flattening and the RSI at 60.8, bulls face a genuine test rather than an automatic continuation.
Bull Power Meets Overbought Signals
Silver’s uptrend structure remains intact. Price trades above the 200-SMA, the SuperTrend indicator holds green, and the Ichimoku Cloud offers additional support beneath current levels. Volume is climbing alongside the breakout, a key requirement for validating any triangle pattern rather than dismissing it as a false start. Still, two signals urge caution: the MACD histogram is losing steam even as price rises, and the RSI’s approach toward overbought territory suggests the rally’s pace may be difficult to sustain without a pause.
- MACD histogram flattening despite the price breakout
- RSI at 60.8, nearing overbought
- Price extended near the upper Bollinger Band at $70.11
Breakout Zones and Invalidation Levels
Only 10% of the ascending triangle’s measured-move target has played out, meaning the pattern is early rather than exhausted. Aggressive traders can lean on real-time momentum, while more conservative positioning waits for a pullback toward $68.50, where the Ichimoku Cloud, VWAP, and 20-period SMA converge into a defined support shelf. The $68.50–$70.00 range is best avoided for new entries, since it sits in a chop zone where whipsaws are common and directional odds are unclear.
Two levels define the setup’s boundaries. A close below $67.50 would break the bullish structure and negate the triangle. On the upside, a sustained move above $71.00 could trigger a short squeeze, since sellers positioned against the breakout would be forced to cover. Bears should wait for confirmed reversal signals or a break below $67.40 rather than fading strength into resistance, given how quickly momentum has moved against short positions elsewhere in this year’s rally.
Conclusion: Breakouts Require Confirmation, Not Assumptions
A close above $70.40 is a meaningful technical event, but silver’s breakout is still in its early stage, with most of the ascending triangle’s target move still ahead. History shows that even confirmed breakouts frequently retest their trigger level before trending cleanly, so patience matters more than urgency here. The signals worth tracking are straightforward: sustained volume above $70.40, a steadying MACD histogram, and a hold above the $68.50 support shelf on any pullback. Until those align, chasing the move without a defined risk level remains the costliest mistake a trader can make.
Sources & Methodology
Primary-source standard: Market-moving facts should link to original data releases, regulator notices, company filings or official project announcements whenever available. Secondary reporting is used for additional context, not as a substitute for original evidence.
Page last reviewed: