
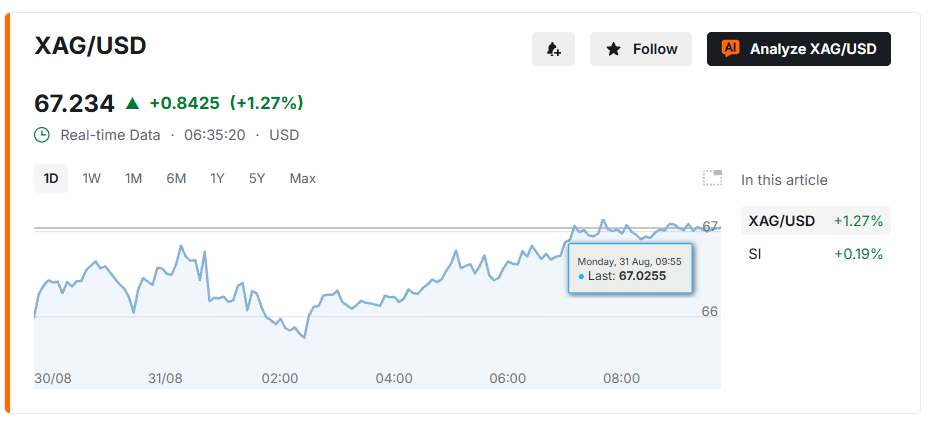
Silver has broken below both its 20- and 50-period moving averages on the 5-hour chart, sliding to $66.71. The move signals a short-term trend reversal just as price tests a major high-volume support zone, setting up a critical test for bulls and bears heading into the next session.
Price action on the 5-hour timeframe is buckling. A sharp rejection from $71.16 sent silver tumbling through the 20 SMA at $68.47 and the 50 SMA at $67.58, leaving it resting at $66.71, just above a high-liquidity area buyers now need to defend. Trading below both moving averages hands short-term control to sellers, though the broader uptrend is not yet broken: the 200 SMA, a longer-term trend gauge, still sits well below at $62.11.
Momentum Indicators Send Mixed Signals
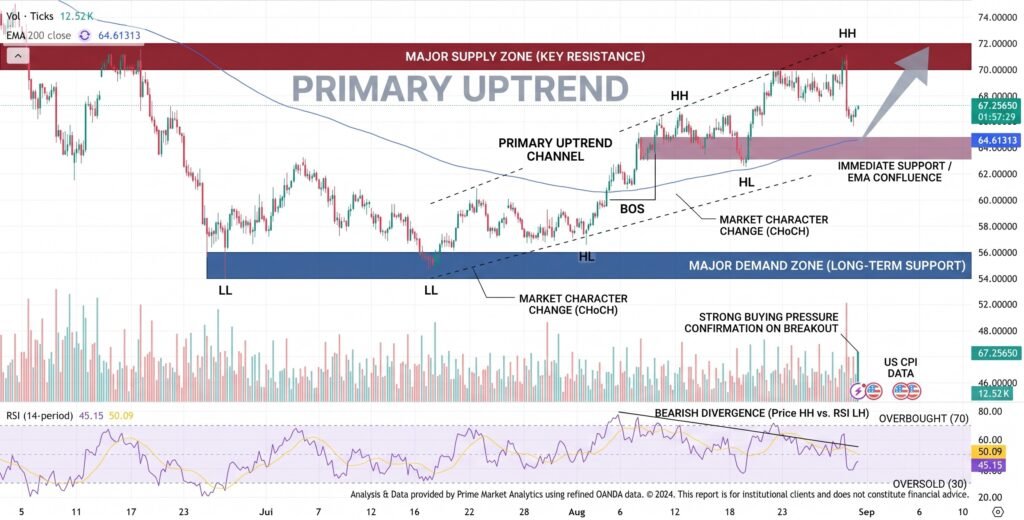
Beyond the moving averages, several other gauges are flashing at once. The Ichimoku cloud, a Japanese charting tool that maps support and resistance bands, has price sitting at its lower edge; a close beneath that band could remove another layer of support and accelerate the decline. The MACD, a momentum indicator, is turning lower, with its main line at -0.0978 versus a signal line of 0.2666, underscoring how quickly selling pressure is building. Meanwhile, the ADX, which measures trend strength rather than direction, reads 25.51, indicating a clear but orderly bearish trend rather than a panic-driven selloff.
The $66.00 Level Is the Line in the Sand
The high-volume node between $66.00 and $67.00 has become the key battleground. A confirmed 5-hour close below $66.00 would likely trigger technical stop-losses and open the door to a deeper slide toward the 200 SMA at $62.11. If buyers instead defend this zone, silver could attempt a bounce back toward the lost 20 and 50 SMAs, though that recovery would now run into resistance at the very levels that failed as support.
Traders are watching a few specific triggers:
- A 5-hour close under $66.00 would confirm the primary bearish risk and target $62.11
- A reclaim of $67.58, the 50 SMA, would be needed before bears’ control is considered contained
- A volume surge near $66.00 could mark either capitulation or fresh accumulation
What This Setup Means for Traders
This is a textbook case of layered support giving way. When price breaks through multiple moving averages stacked alongside a heavy-volume zone, the next meaningful support level is often far lower than expected. Clustered technical levels like this one tend to attract concentrated stop orders, so a decisive close beneath them can trigger outsized, fast-moving price swings rather than a gradual drift.
Sources & Methodology
Primary-source standard: Market-moving facts should link to original data releases, regulator notices, company filings or official project announcements whenever available. Secondary reporting is used for additional context, not as a substitute for original evidence.
Page last reviewed: