
Silver is trading near $56.48 in the supplied five-hour chart snapshot, with a reported Bear Flag breakdown reinforcing the short-term bearish outlook. Prices remain below the 20-, 50- and 200-period moving averages, while the Moving Average Convergence Divergence (MACD) continues to signal selling pressure. However, deeply oversold momentum indicators suggest a temporary rebound is possible. Traders are now watching support near $55.10 to determine whether silver can stabilize or extend its decline.
Silver Bear Flag Keeps Sellers in Control
The silver price remains below its key moving averages, indicating that sellers retain control of the near-term trend. A Bear Flag is a chart pattern in which a brief consolidation or modest rebound follows a sharp decline before the price potentially resumes falling. The reported breakdown suggests the previous recovery failed to establish lasting buying interest.
A bearish Marubozu candle near $56.44 on October 14 added to the negative technical picture. This candle type has little or no shadow and typically reflects strong selling when it closes near its low. The SuperTrend indicator places resistance around $58.57, while the MACD reading of -1.20 sits below its signal line at -0.78.
That negative MACD configuration indicates downward momentum remains dominant. Still, chart patterns and indicators describe probabilities rather than guaranteeing the next move.
Oversold Signals Raise Bounce Risk
Silver’s Relative Strength Index (RSI) stands at 27.67, below the commonly watched 30 threshold, while the Money Flow Index (MFI) is at 19.37. Both readings suggest selling has become stretched. The RSI measures the speed and magnitude of recent price changes, while the MFI incorporates price and volume to estimate buying and selling pressure.
Oversold conditions can attract bargain hunters and prompt short sellers to take profits. They do not, however, confirm a trend reversal: prices can remain oversold during persistent declines.
The immediate technical levels are:
- Primary support: $55.10, where buyers may attempt to stabilize prices.
- Bearish threshold: A sustained move below $55.00 could expose further downside.
- Initial resistance: $57.50–$58.00, depending on the strength of any rebound.
- Trend-reversal hurdle: Around $58.60, near the reported SuperTrend resistance.
A recovery above $58.60 would challenge the immediate bearish structure, although stronger confirmation would still be needed.
Silver Outlook: Rebound or Fresh Low?
The balance of evidence continues to favor caution. The Bear Flag breakdown, negative MACD and position below major moving averages all point to a weak trend. Meanwhile, oversold readings increase the risk of sharp countertrend rallies that could catch traders positioned too aggressively for further losses.
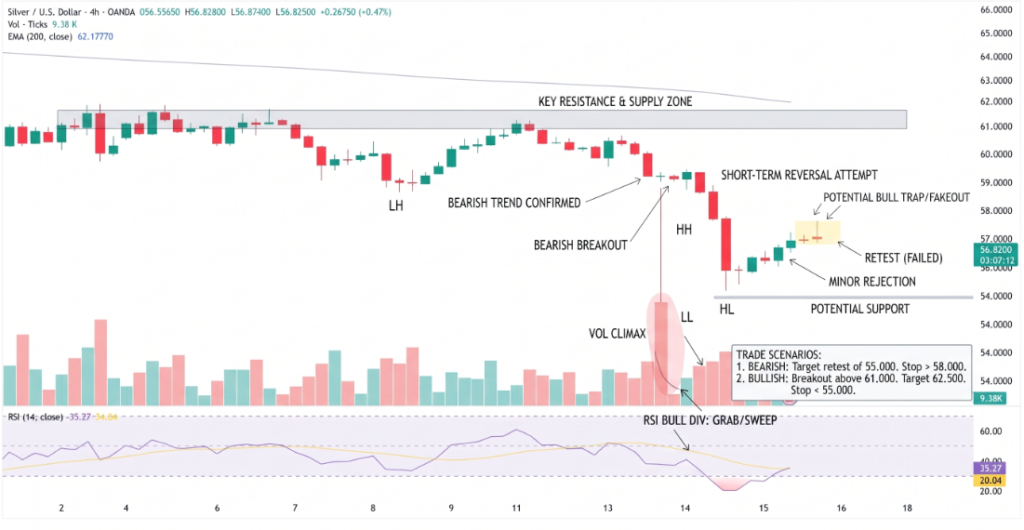
The area between $55.50 and $57.50 may produce choppy trading, making direction less clear until silver moves decisively beyond that range.
Conclusion:
Silver remains vulnerable near $56.48, with $55.10 the key support to watch. A break below that level could extend the decline, while a sustained recovery above $58.60 would weaken the bearish case. Traders should wait for price confirmation, define risk limits and avoid relying on oversold readings alone to predict a bottom.
Sources & Methodology
Primary-source standard: Market-moving facts should link to original data releases, regulator notices, company filings or official project announcements whenever available. Secondary reporting is used for additional context, not as a substitute for original evidence.
Page last reviewed: