
Silver is testing a critical technical level after the five-hour chart recorded a close at $58.78, marginally below support at $58.80. The move places sellers in control, while weak momentum indicators and rising volume point to continued downside risks. However, readings near oversold territory suggest that a short-term rebound remains possible. With silver recently under pressure amid uncertainty over U.S. inflation and Federal Reserve policy, traders are watching whether the metal can reclaim lost support or extend its decline toward lower price levels.
Silver Breaks Below $58.80 Support
The latest five-hour chart shows silver slipping beneath $58.80, a level identified by the supplied technical analysis as both a 78.6% Fibonacci retracement and the lower boundary of a descending price channel. A sustained move below this area could reinforce the bearish trend, particularly if subsequent candles confirm the breakdown.
The broader technical picture also favors sellers. Silver is trading below its 20-, 50- and 200-period moving averages on the cited chart, while the Moving Average Convergence Divergence (MACD) stands at -0.40 against a signal line of -0.25. These negative readings indicate that downward momentum remains dominant.
The reported increase in trading volume adds weight to the breakdown attempt, suggesting that selling interest is expanding rather than fading. Still, a brief move beneath support does not guarantee a sustained decline. Traders generally look for a candle close below the level and follow-through selling before treating the break as confirmed.
Oversold Signals Raise Rebound Risks
Despite the bearish setup, silver’s momentum readings suggest that selling may be becoming stretched. The supplied chart records a Relative Strength Index (RSI) of 34.03 and a Money Flow Index (MFI) of 28.00. Both indicate weakness, although neither reading alone guarantees an immediate reversal.
Price is also touching the lower Bollinger Band, which can signal that the market has moved sharply relative to its recent trading range. Such conditions can precede a technical bounce, but prices may remain weak while selling pressure persists.
Key levels to monitor include:
- $58.80: Former support that sellers need to keep below to maintain downside pressure.
- $60.28: Upper boundary of the cited consolidation zone and a potential recovery hurdle.
- $104.65: The supplied text’s stated downside confirmation level appears inconsistent with the current silver price and should not be used as a silver target without correction.
Silver Outlook: Confirmation Matters
The immediate outlook remains bearish while silver trades below $58.80 and its key moving averages. If the breakdown holds, traders may look for further downside, but the next target should be established from a verified silver chart rather than inferred from incomplete levels.
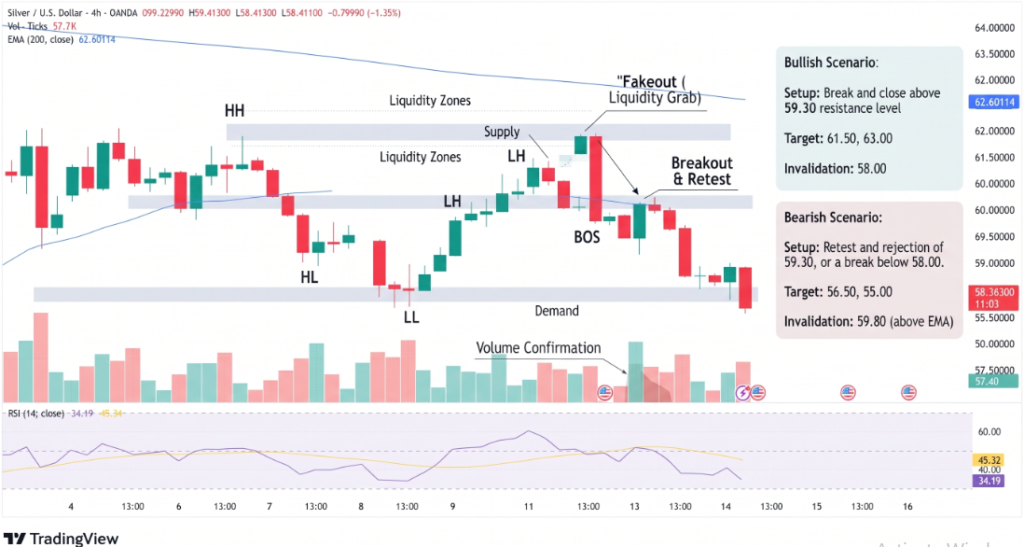
A recovery above $58.80 would weaken the immediate breakdown signal; a move through $60.28 would provide stronger evidence of a rebound. Until either scenario is confirmed, the $58.80–$60.28 area may produce volatile, directionless trading.
Conclusion:
Silver’s technical bias remains negative, but oversold readings increase the risk of sharp countertrend moves. Traders should wait for confirmation, define stop-loss levels around market volatility and avoid treating one support breach as a complete trend signal.
Sources & Methodology
Primary-source standard: Market-moving facts should link to original data releases, regulator notices, company filings or official project announcements whenever available. Secondary reporting is used for additional context, not as a substitute for original evidence.
Page last reviewed: