Silver is attempting to recover after bouncing from $61.67 on the five-hour chart, placing the metal near an important Fibonacci support area. The rebound follows a sharp decline from $71.16, while the broader technical structure remains under pressure. Silver is trading below its major moving averages, and momentum indicators continue to reflect selling pressure. The latest market backdrop also remains challenging for precious metals as elevated U.S. Treasury yields and uncertainty over the Federal Reserve rate outlook keep demand sensitive to changes in interest-rate expectations. On September 30, spot silver was around $61 an ounce, according to live market data.
Silver Trend Remains Bearish
The five-hour chart shows a clear sequence of lower prices after silver’s retreat from $71.16. The 20-, 50- and 200-period moving averages are all trending lower, while price remains below each of them. That alignment keeps the prevailing technical bias tilted toward sellers.
The MACD remains negative, indicating that downside momentum has not yet been fully reversed. Meanwhile, the RSI at 37.88 is approaching oversold territory. An RSI below 30 is generally viewed as oversold, meaning the current reading leaves room for further weakness while also allowing for a technical rebound.
The broader silver market has also remained volatile. Silver traded around $60.95 per ounce in the latest September 30 snapshot, with an intraday range of roughly $60.71 to $61.85.
$61.18 Support Holds the Key
The immediate focus is the $61.18 area, corresponding to the 61.8% Fibonacci retracement in the supplied five-hour setup. Holding this level would keep the recent rebound technically viable, while a decisive break beneath it would expose the next structural support.
Key levels include:
- $61.18: 61.8% Fibonacci support
- $60.63: Structural swing-low support
- $62.70: Near-term resistance
- $64.37: Bearish SuperTrend resistance
The $61.18-$62.70 band is therefore a critical decision area. Price movement inside this range could remain volatile as buyers attempt to defend support while sellers protect overhead resistance.
$62.70 Reclaim Needed for Recovery
A sustained move above $62.70-$62.80 would provide the first meaningful technical signal that the immediate selling pressure is easing. That zone combines the nearby 20-period moving average with the 50% Fibonacci retracement, making it an important barrier for any recovery attempt.
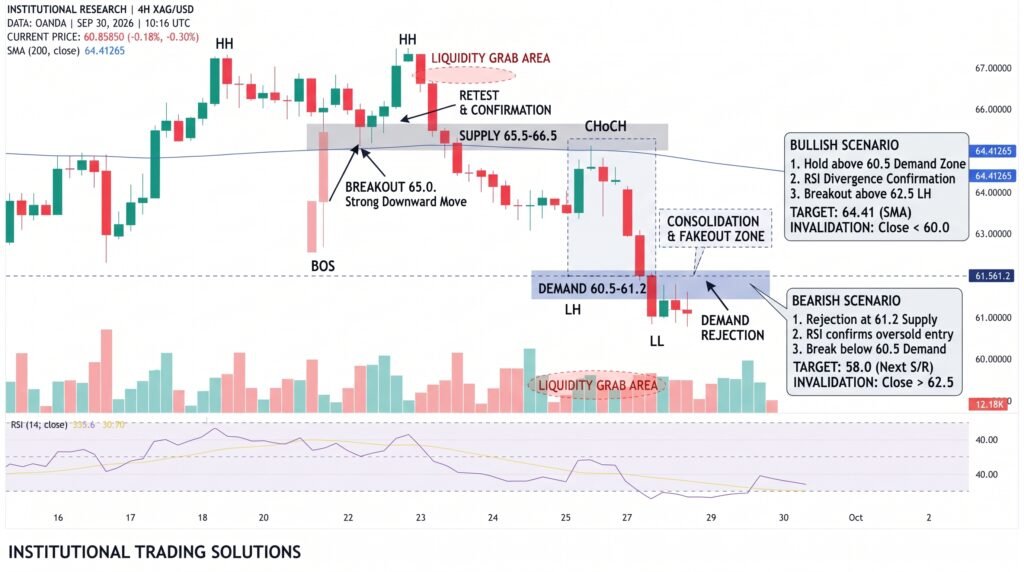
Above that area, $64.37 represents the next major obstacle because the SuperTrend indicator remains bearish there. A break through that level would carry greater significance than a brief move above $62.70 because it would challenge the prevailing five-hour downtrend.
Conversely, failure to reclaim $62.70 would leave silver vulnerable to another test of $61.18. A break below that support could shift attention toward $60.63, while persistent selling below the swing-low would signal that the correction is extending rather than forming a short-term base.
The broader macro backdrop remains important. U.S. Treasury yields were still elevated on September 30, although the 10-year yield eased to about 5.214% after Federal Reserve commentary reduced immediate expectations for another rate increase.
Conclusion
Silver’s $61.67 bounce has placed the metal at a critical technical junction, but the five-hour structure remains bearish while price stays below its major moving averages. $61.18 is the first support that needs to hold, with $60.63 below it. On the upside, a sustained recovery above $62.70-$62.80 would strengthen the rebound, while $64.37 remains the larger trend barrier. Until those levels are breached, silver’s broader downside structure remains intact.
Sources & Methodology
Primary-source standard: Market-moving facts should link to original data releases, regulator notices, company filings or official project announcements whenever available. Secondary reporting is used for additional context, not as a substitute for original evidence.
Page last reviewed: