
Silver has pulled back sharply after touching a nominal record high of $121.67 in January 2026. The metal still gained more than 15% in August, but a firmer U.S. dollar, rising Treasury yields, and hawkish comments from Federal Reserve Chair Kevin Warsh have driven a fast retreat toward two-week lows. On the 5-hour chart, that pressure has broken silver’s medium-term uptrend, pushing price under the Ichimoku cloud to $64.76 — just above the closely watched $64.00 support. A break lower opens the door toward $62.32; a defense here could spark a relief bounce instead.
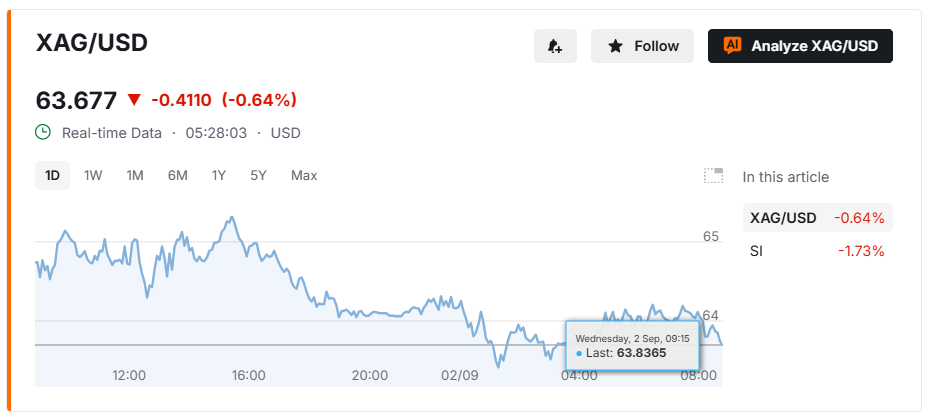
Trend Breakdown Confirmed
Silver has decisively exited its medium-term uptrend, falling beneath the Ichimoku cloud spanning $64.59 to $66.80. That shift is a classic signal that sellers, not buyers, are setting the pace. Momentum indicators back the move: the MACD line sits at -0.90, below its signal line at -0.51, while the SuperTrend indicator flipped bearish at $67.94.
Trading volume has picked up on down days, a sign the selling carries real conviction rather than thin, low-liquidity drift. A double-top pattern near $71.16 has also completed — a formation chart analysts treat as strongly bearish, since it marks two failed attempts to clear the same resistance. The technical breakdown lines up with the broader macro picture: rising Treasury yields and a roughly 65% market-implied chance of a September rate hike have made non-yielding metals like silver less attractive to hold.
- Uptrend broken below the $64.59–$66.80 Ichimoku cloud
- MACD (-0.90) trading below its signal line (-0.51)
- Double-top pattern near $71.16 now fully formed
Key Levels Traders Are Watching
The $64.00 mark is the line in the sand. A clean break below it opens the door to $62.32, which lines up with both the 50% Fibonacci retracement and the 200-day moving average (SMA200). That confluence makes the $63.08–$62.32 zone the most likely spot for buyers to defend the broader trend, which had carried silver up more than 62% over the past year before this pullback.
There’s a case for bulls, too. The Relative Strength Index (RSI) reads 36.63, edging toward oversold territory below 30 — a level that often precedes short-term relief rallies, especially near a well-defined support band. Treat $64.00–$66.00 as a chop zone, where congestion and mixed volume make directional bets riskier.
- $64.00 support: a break sends price toward $62.32
- $63.08–$62.32: Fibonacci and SMA200 confluence zone
- RSI at 36.63: nearing oversold, a possible bounce trigger
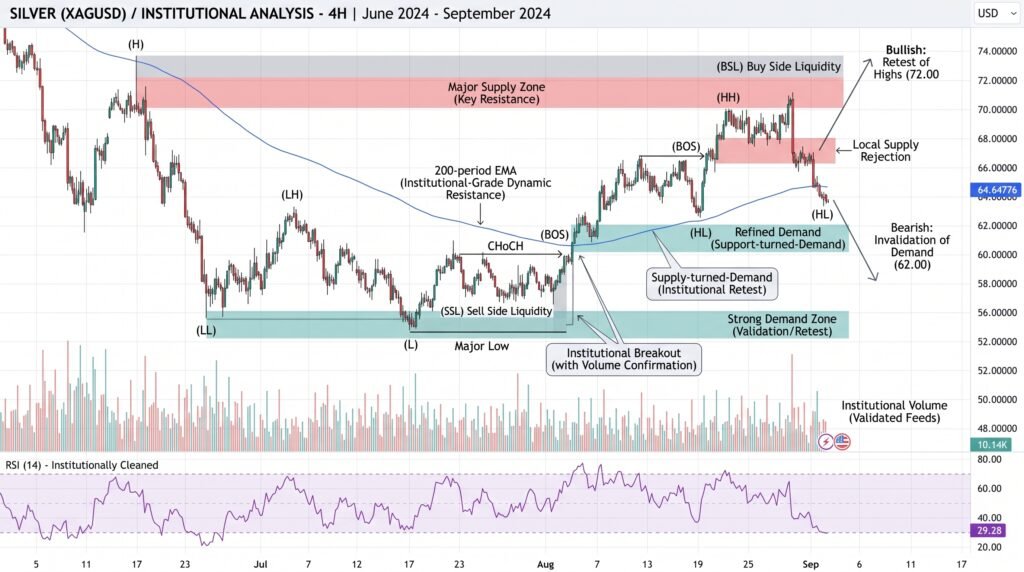
Bulls or Bears: Who Wins Next
The technical weight currently favors sellers. A broken uptrend, a bearish MACD cross, and a completed double top form a textbook “trade with the trend” setup, and rising volume on declines reinforces the edge for bearish plays below $65.50. Still, oversold conditions near $62.32 mean sharp reversals are possible, and any rally stalling at the lower edge of the Ichimoku cloud near $66.80 risks becoming a bull trap rather than a genuine trend change.
Conclusion: Discipline Over Conviction
Silver’s breakdown below its uptrend, paired with a confirmed double top and bearish momentum readings, puts sellers in control heading into the next session. The $64.00 level is the immediate pivot, and a failure there targets $62.32, where Fibonacci and SMA200 support converge. An oversold RSI keeps a bounce on the table, so traders should watch for reversal candles or a MACD crossover near $63.08–$62.32 before assuming the drop is over. With the Federal Reserve’s rate decision still ahead and yields elevated, volatility is likely to stay high in either direction — tight stop-losses matter more than a fixed view on direction.
Sources & Methodology
Primary-source standard: Market-moving facts should link to original data releases, regulator notices, company filings or official project announcements whenever available. Secondary reporting is used for additional context, not as a substitute for original evidence.
Page last reviewed: