
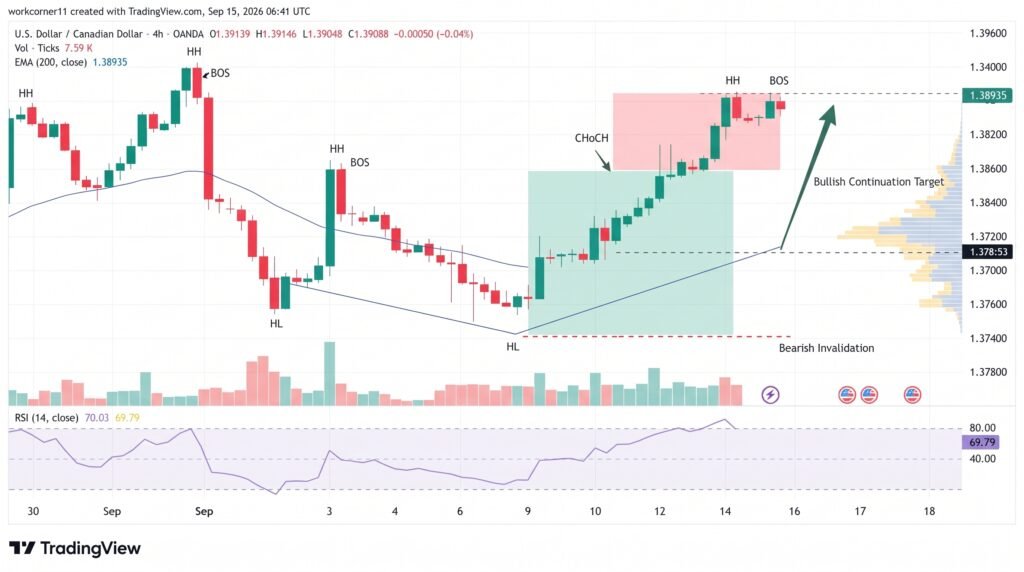
USD/CAD extended its advance to a fifth straight session Tuesday, trading near 1.3910 as buyers tested the 50-day Exponential Moving Average at 1.3914. The move has pushed the pair slightly above the upper boundary of a descending channel, creating the possibility of a bullish reversal. However, the breakout remains unconfirmed, leaving the market vulnerable to a false move back inside the channel.
The Canadian dollar weakened to 1.3915 per U.S. dollar on Monday, its lowest level in 12 days, as stronger U.S. dollar demand outweighed support from crude oil prices.
Fed Bets Give Dollar an Edge
The macro backdrop is increasingly favorable for the U.S. dollar. August U.S. CPI rose 0.4% month over month and 3.4% year over year, while core inflation increased 0.3% in August. The data reinforced expectations that the Federal Reserve could resume tightening at its September 15–16 meeting.
Markets now put the probability of a 25-basis-point Fed increase near 93%, according to CME pricing cited by Reuters. The move would lift the federal-funds target range to 3.75%–4.00%.
The contrast with Canada matters for USD/CAD. The Bank of Canada kept its overnight rate at 2.25% on September 2, leaving a substantial policy gap if the Fed raises rates this week.
Canadian inflation also offers little immediate reason for the BoC to match the Fed. Consumer prices held at 3% annually in August, while core measures remained close to 2%. Higher gasoline costs, however, remain an important inflation risk as crude prices stay elevated.
Technical Breakout Faces Confirmation
The daily chart shows USD/CAD slightly above the descending channel’s upper trendline, but technical confirmation is still missing. The 50-day EMA at 1.3914 is the immediate barrier. A decisive daily close above it would strengthen the bullish case and signal that the recent decline has potentially reversed.
The 9-day EMA at 1.3861 is the first important support. As long as price remains above that average, short-term momentum favors buyers. The 14-day RSI near 54 also points to improving momentum without indicating overbought conditions.
A confirmed breakout could expose the 1.4248 area, the nearly 17-month high recorded on June 24. By contrast, a rejection from 1.3914 followed by a move below 1.3861 would raise the probability that the move above the channel was a false breakout.
Oil, Trade Risks Add Two-Way Volatility
Crude oil remains an important counterweight to dollar strength. Canada is a major oil exporter, so higher prices can support the Canadian dollar through stronger export revenues. Yet the current oil rally is also contributing to global inflation, strengthening expectations for higher U.S. rates.
Brent crude recently traded near $107 a barrel, while WTI was above $102, after attacks disrupted Saudi energy infrastructure and raised concerns about global supply.
For USD/CAD, the key levels are:
- Breakout: 1.3914
- First support: 1.3861
- Bullish target: 1.4248
- Major downside levels: 1.3560 and 1.3481
Conclusion
USD/CAD is approaching a decisive technical test as it challenges the 1.3914 50-day EMA and the upper boundary of its descending channel. Strong Fed hike expectations and a wide U.S.-Canada rate differential favor the dollar, while elevated oil prices provide some support for the Canadian dollar. A sustained close above 1.3914 would strengthen the bullish reversal case and put 1.4248 in view. Failure to hold above the channel, especially below 1.3861, would instead revive the broader bearish structure.
Sources & Methodology
Primary-source standard: Market-moving facts should link to original data releases, regulator notices, company filings or official project announcements whenever available. Secondary reporting is used for additional context, not as a substitute for original evidence.
Page last reviewed: