
Zcash (ZEC) traded near $1,278 on Monday, October 12, holding onto the previous session’s 4% advance after three consecutive days of gains. However, the recovery faces resistance as investors continue withdrawing money from Grayscale’s Zcash exchange-traded fund (ETF), raising questions about institutional demand. Data from SoSoValue shows the fund recorded $30.72 million in net outflows last week, following $93.56 million in withdrawals the week before. Meanwhile, ZEC remains below key moving averages on the four-hour chart, leaving the $1,050 support level exposed if selling pressure returns.
Grayscale ETF Outflows Weigh on ZEC
Grayscale’s ZCSH ETF has experienced a sharp reversal in investor flows following a strong September. According to SoSoValue’s ETF data, weekly net outflows reached $30.72 million, compared with $93.56 million during the preceding week. Although withdrawals have slowed, the fund continues to face redemption pressure.
The figures suggest that demand for regulated investment exposure to ZEC has weakened. However, ETF outflows alone do not establish that investors have abandoned privacy-focused cryptocurrencies, and fund redemptions should not automatically be interpreted as a direct measure of retail sentiment.
The fund’s recent three-for-one share split is another relevant development. The split changed the number of shares and their individual prices without, by itself, changing the total value of an investor’s holdings. It does not independently explain the subsequent outflows.
For ZEC traders, the key issue is whether renewed investment flows can support prices as the token attempts to recover from its recent correction.
ZEC Faces Resistance Near $1,300
On the four-hour chart, ZEC is trading below the 50-period and 200-period exponential moving averages (EMAs), positioned near $1,279 and $1,274, respectively. These indicators track average prices while assigning greater weight to recent trading activity.
The 50-period EMA is declining toward the 200-period EMA. If the shorter-term average crosses below the longer-term average, it would form a potential Death Cross, a technical signal commonly associated with bearish momentum. Such a crossover is not a guarantee of further losses.
The September 9 high near $1,296 also represents resistance. A sustained breakout above this area could strengthen the recovery and bring the $1,422 level, associated with the September 18 price structure, into focus.
Momentum indicators offer some encouragement. The four-hour Relative Strength Index (RSI) is around 58, above its neutral 50 threshold, while the Moving Average Convergence Divergence (MACD) indicator is rising alongside its signal line. Both suggest that buyers are attempting to regain control, although resistance remains unresolved.
Zcash Price Forecast: $1,050 in Focus
The next move depends on whether ZEC can overcome resistance or loses momentum beneath its moving averages.
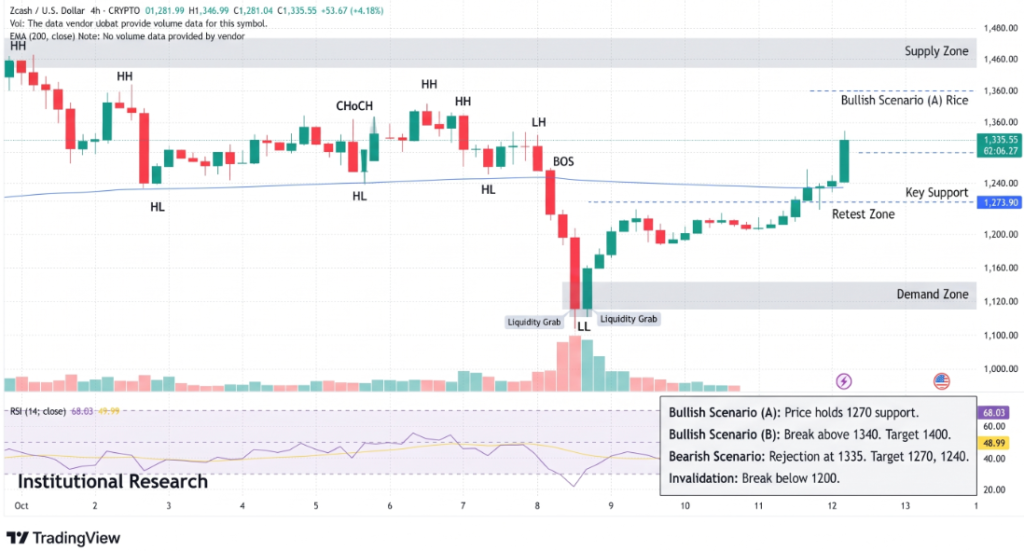
Key technical levels include:
- $1,296: Resistance at the September 9 high.
- $1,274–$1,279: Four-hour EMA resistance zone.
- $1,050: Potential downside target if selling resumes.
- $1,422: Higher recovery objective following a confirmed breakout.
Conclusion
Zcash is attempting to stabilize near $1,278, but persistent ETF outflows and resistance around $1,300 continue to complicate its recovery. Improving RSI and MACD readings suggest that buyers are returning, yet the moving-average structure remains vulnerable to a bearish crossover. A sustained break above $1,296 would improve the near-term outlook, while rejection below the EMAs could expose $1,050. Until either move is confirmed, ZEC’s recovery remains fragile.
Sources & Methodology
Primary-source standard: Market-moving facts should link to original data releases, regulator notices, company filings or official project announcements whenever available. Secondary reporting is used for additional context, not as a substitute for original evidence.
Page last reviewed: