XRP is approaching the critical $1.10 resistance zone as weak trading volume and strong technical barriers raise questions about the cryptocurrency’s next major move.
XRP Meets Critical Resistance
XRP has entered one of its most important technical phases in recent weeks, with the cryptocurrency approaching a resistance zone that has repeatedly halted recovery attempts throughout July. While the digital asset managed to stabilize following its steep June decline, its latest rejection suggests that buyers still lack the strength needed to establish a sustained bullish trend.
The token is currently trading near $1.08, just beneath a significant technical cluster formed by the 50-day and 100-day moving averages between $1.09 and $1.10. These indicators have become the first meaningful resistance level since the broader market correction began, making this area a decisive test for XRP’s short-term direction.
Technical analysts often view the convergence of multiple moving averages as a high-probability decision zone. A successful move above these levels could improve market sentiment, while another rejection may reinforce bearish pressure and extend the current consolidation phase.
Technical Signals Favor Caution
The daily price chart reveals that XRP recently attempted to break out from an ascending triangle pattern, a formation typically associated with bullish continuation. However, the breakout quickly lost momentum as buying interest faded before the price could establish itself above resistance.
Instead of maintaining upward movement, XRP slipped back below its breakout level and is now consolidating beneath the moving averages. Although the decline was relatively limited, it highlights an important trend: sellers continue to emerge whenever the price approaches key resistance.
The longer-term technical picture remains challenging. XRP still trades well below its 200-day moving average, positioned near $1.21, which continues to slope higher. Until buyers reclaim this longer-term benchmark, the broader market structure remains neutral to bearish despite recent price stabilization.
Key technical levels to monitor include:
- Immediate resistance: $1.09–$1.10
- Long-term resistance: Around $1.21 (200-day moving average)
- Current trading zone: Approximately $1.08
- Key catalyst: Sustained buying volume above resistance
Volume Will Determine the Next Move
Beyond price action, trading activity continues to raise concerns about the strength of XRP’s recovery. Recent rebound attempts have occurred on relatively modest volume, suggesting institutional and retail participation remains limited.
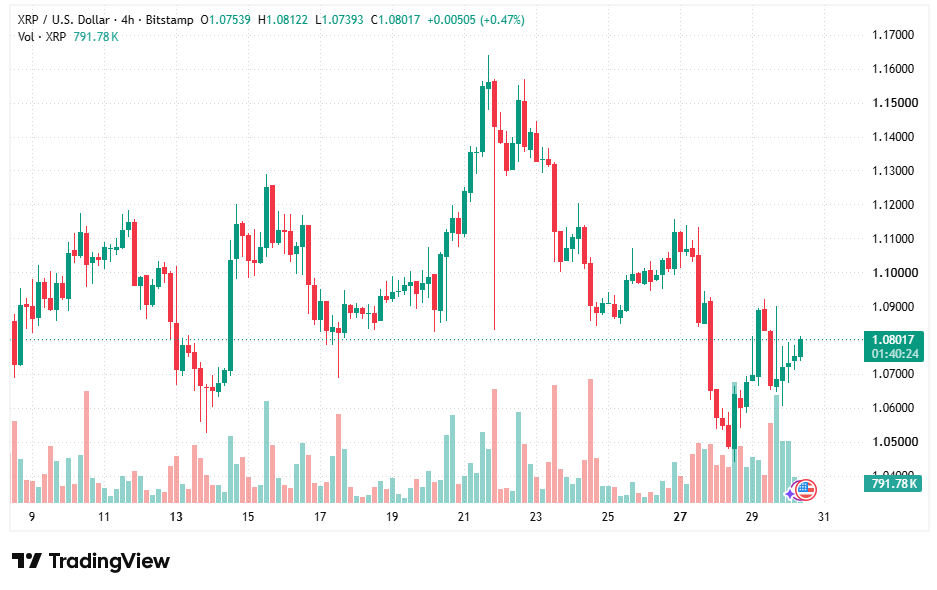
Historically, meaningful breakouts in cryptocurrency markets are supported by rising trading volume, reflecting stronger investor conviction. Without that confirmation, rallies often struggle to hold gains as sellers quickly regain control.
For XRP to shift toward a stronger bullish outlook, buyers must overcome the $1.10 resistance zone with convincing momentum while gradually reclaiming higher moving averages. Until then, the asset is likely to remain range-bound, with market participants closely watching whether fresh demand emerges or another rejection reinforces the prevailing cautious sentiment.
The coming sessions could prove pivotal, as XRP stands at a technical crossroads where price action, volume, and investor confidence will collectively determine whether the cryptocurrency can transition from recovery mode into a more sustainable upward trend.
Sources & Methodology
Primary-source standard: Market-moving facts should link to original data releases, regulator notices, company filings or official project announcements whenever available. Secondary reporting is used for additional context, not as a substitute for original evidence.
Page last reviewed: