Quick Answer
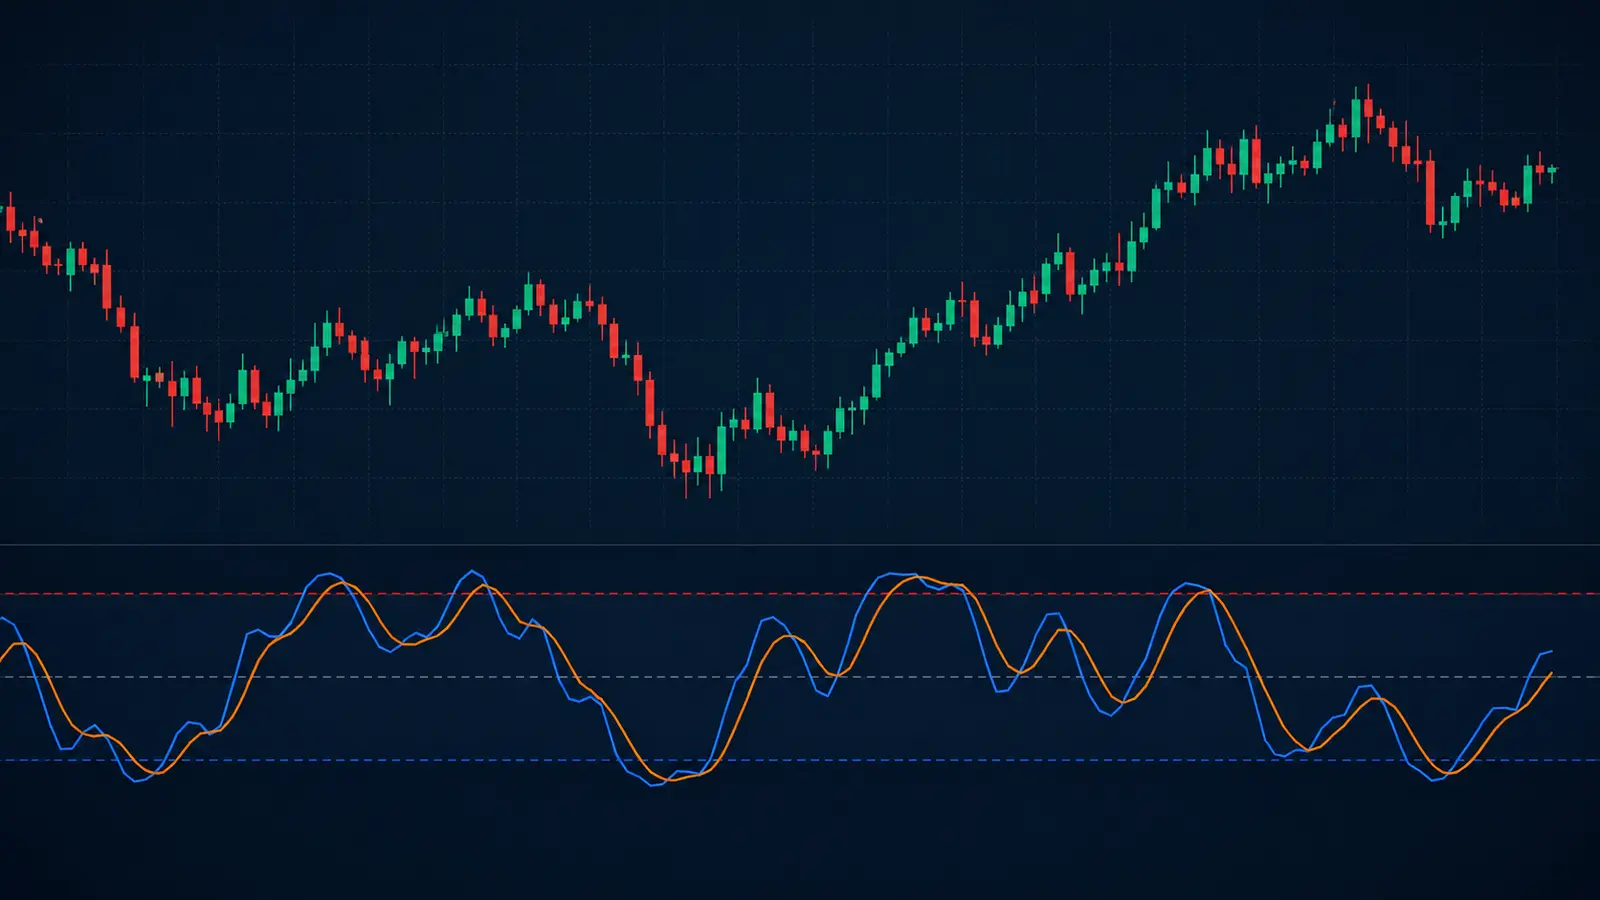
Stochastic RSI, or StochRSI, is a momentum oscillator that applies the Stochastic formula to RSI values rather than directly to price. It measures where the current RSI sits relative to its own recent high-low range, making it more sensitive than standard RSI. StochRSI usually moves between 0 and 100 on charting platforms, with 80 and 20 used as common overbought and oversold reference zones. Traders also watch the %K and %D lines for crossovers, divergence and momentum resets. Because StochRSI reacts quickly, it can create many false signals in strong trends; it works best when combined with price structure, trend direction and a defined risk level.
What Is Stochastic RSI?
Stochastic RSI is not the same thing as the standard Stochastic Oscillator. This distinction matters because the two indicators are often confused. The standard Stochastic Oscillator compares a closing price with the recent price high-low range. StochRSI compares an RSI reading with the recent high-low range of RSI itself.
The standard Stochastic Oscillator is associated with George Lane. Stochastic RSI was later introduced by Tushar Chande and Stanley Kroll in The New Technical Trader. The purpose was to create a more sensitive oscillator by applying stochastic logic to RSI values.
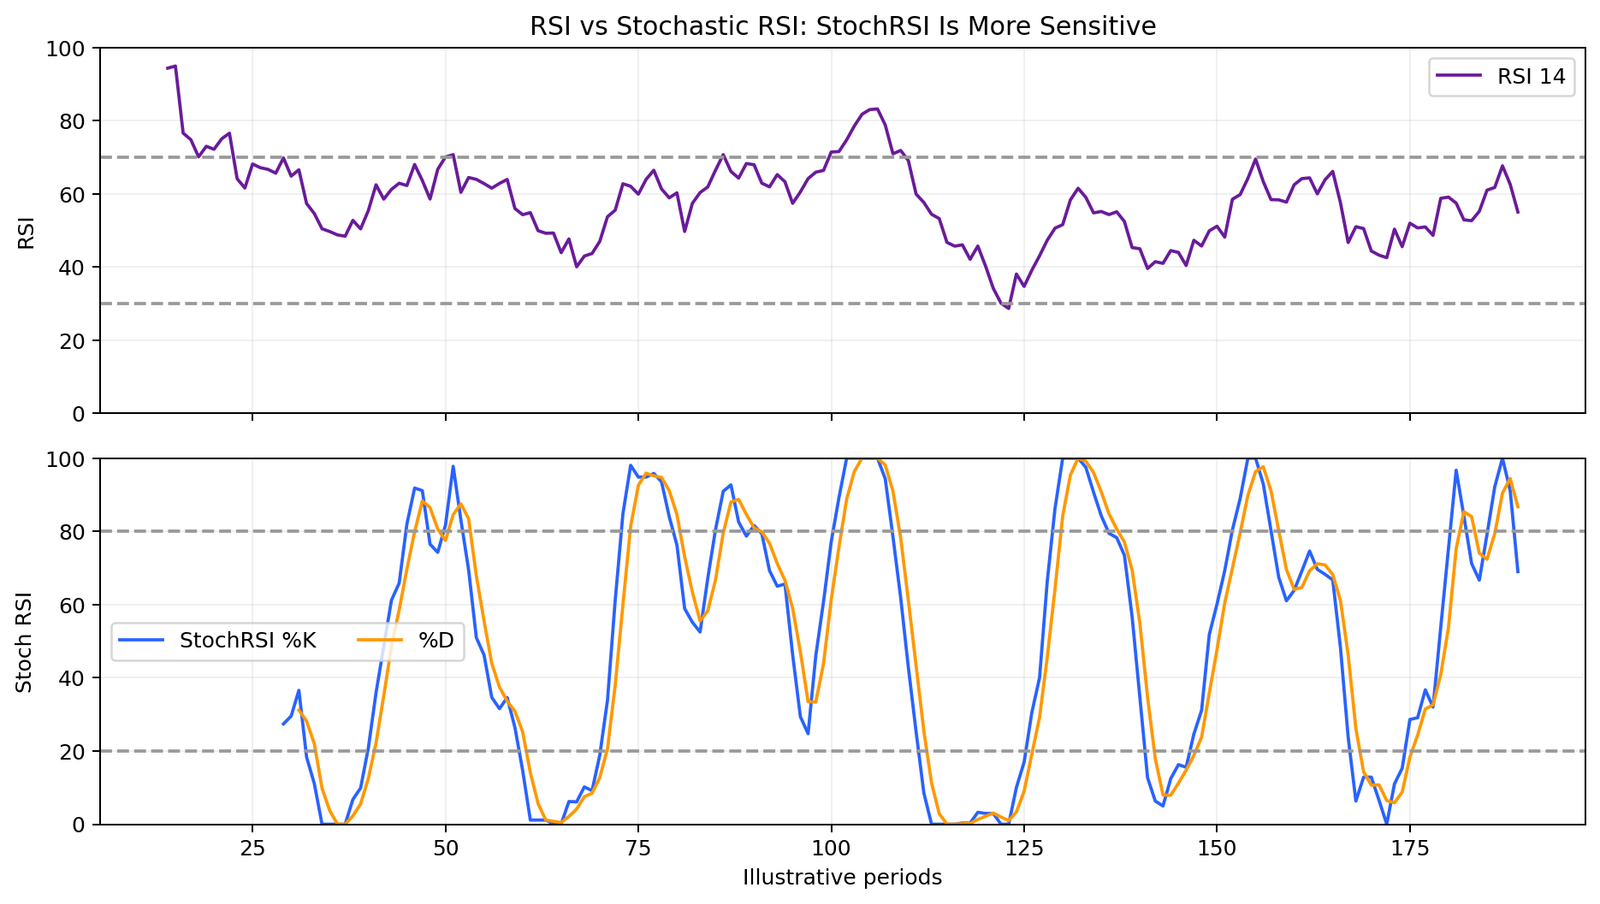
In practice, StochRSI often reaches extreme readings more frequently than RSI. That can be useful for short-term momentum timing, but it also means the indicator can become noisy if traders treat every 80/20 reading or crossover as a trade.
Why Traders Use Stochastic RSI
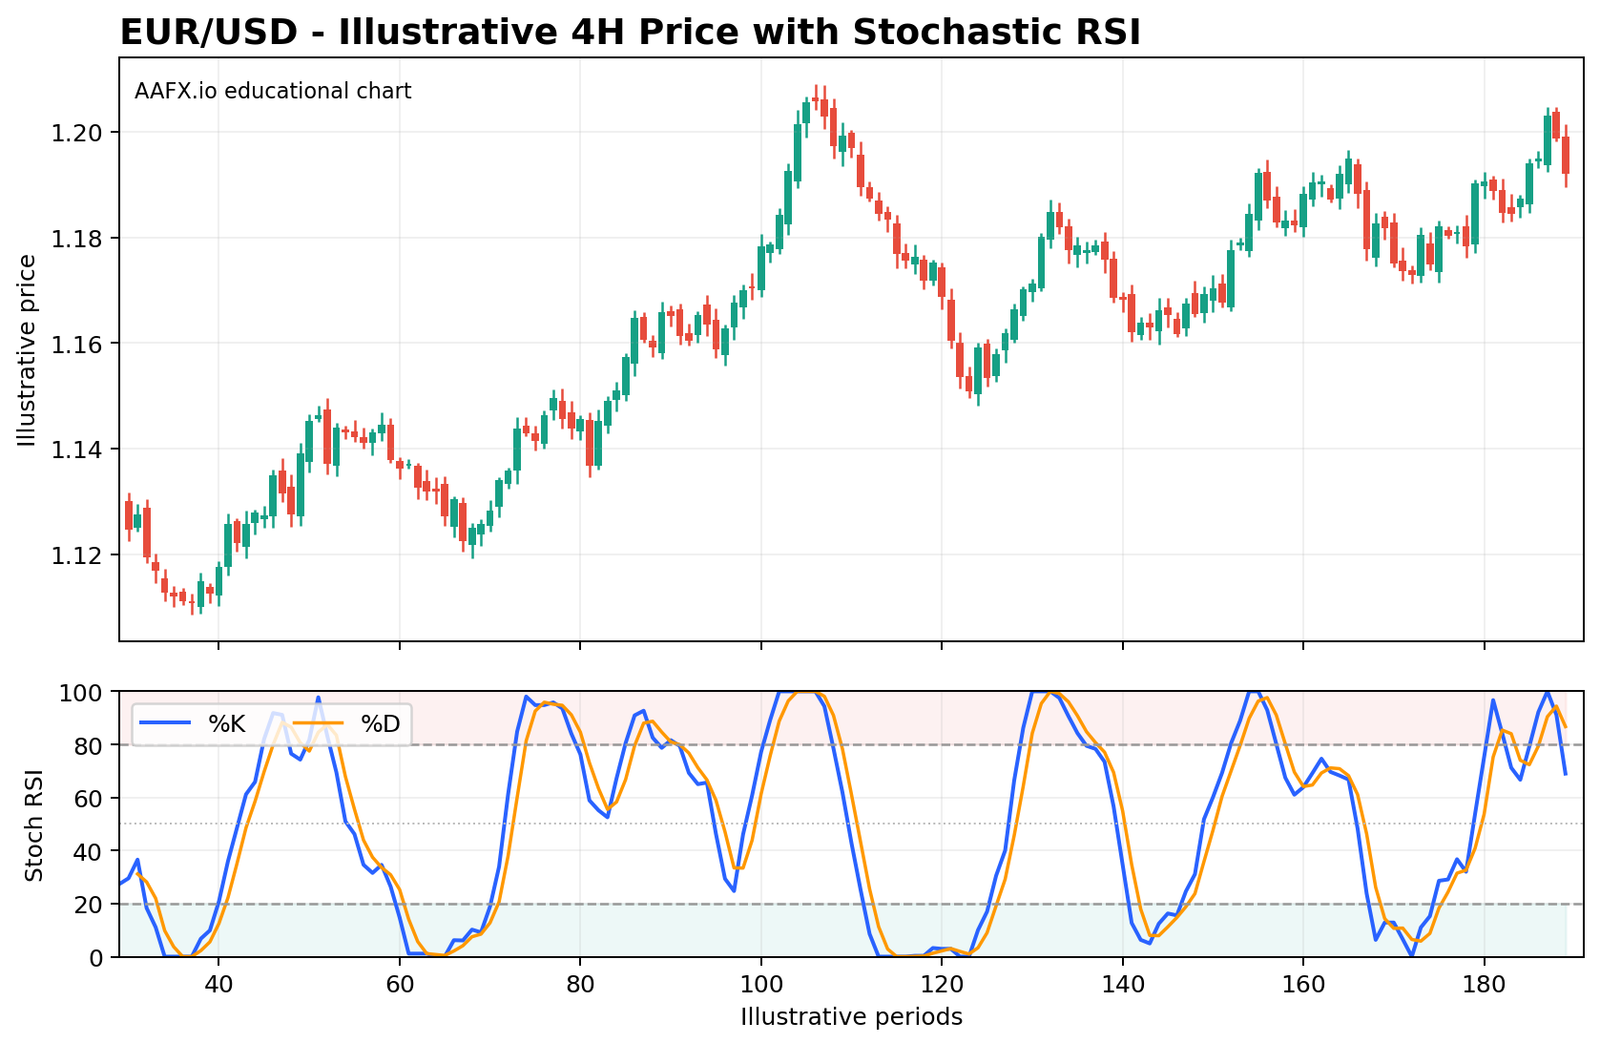
StochRSI is useful when a trader wants a faster view of momentum than standard RSI provides. It can help identify short-term momentum resets inside a trend, range extremes, %K/%D crossovers and divergence. The trade-off is sensitivity: faster response means more signals, not necessarily better signals.
Stochastic RSI Formula
The raw StochRSI calculation asks where the current RSI sits within the recent RSI range.
StochRSI = (Current RSI – Lowest RSI) / (Highest RSI – Lowest RSI)
The result is naturally between 0 and 1. Many charting platforms multiply it by 100 so the oscillator appears on a 0-100 scale. The “lowest RSI” and “highest RSI” are measured over the chosen Stochastic lookback, commonly 14 periods.
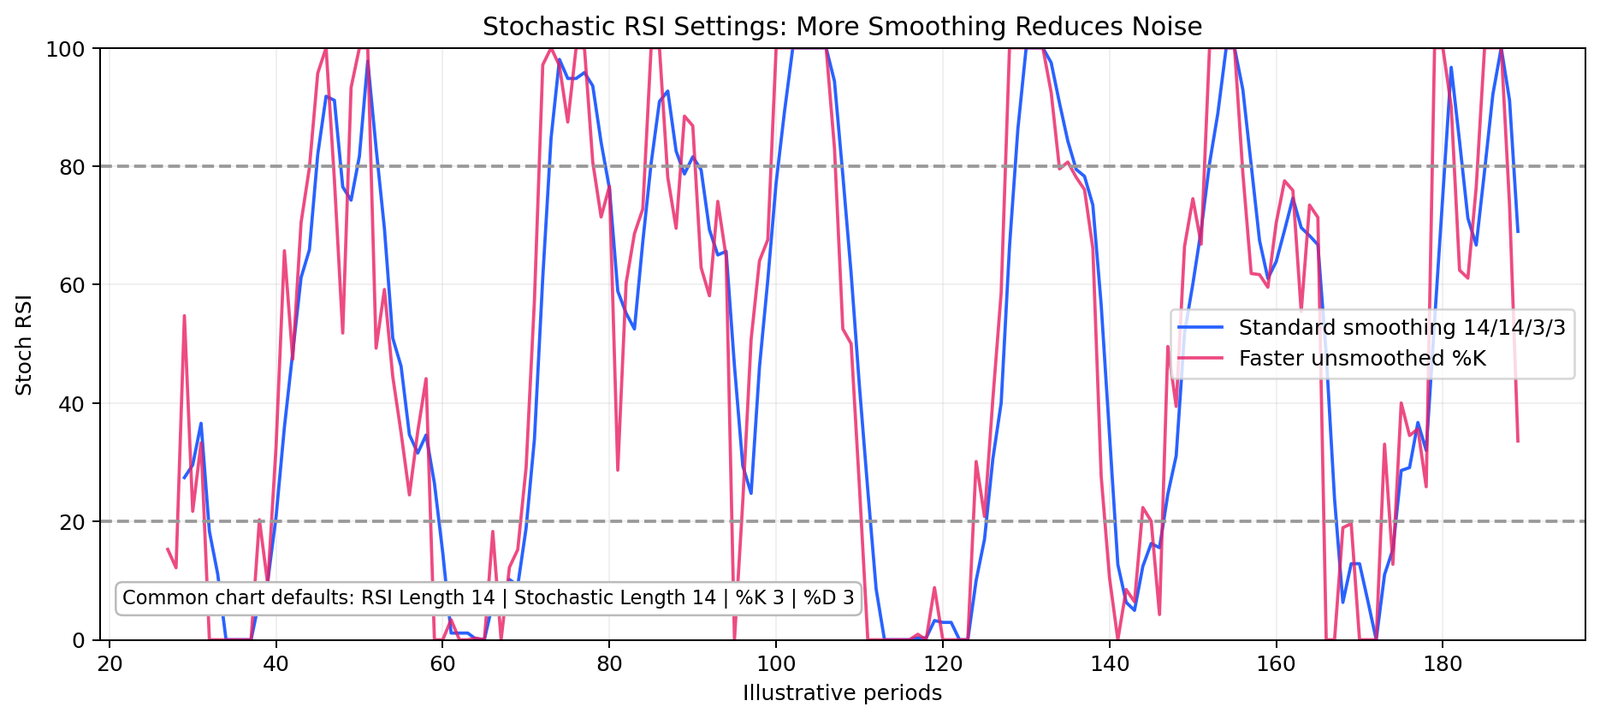
Most chart versions then smooth the raw StochRSI into a %K line and smooth %K again into a %D signal line. This is why the commonly seen setup is written as 14, 14, 3, 3: RSI length 14, Stochastic length 14, %K smoothing 3 and %D smoothing 3.
Stochastic RSI vs RSI vs Stochastic Oscillator
| Indicator | Input | Common zones | Typical behaviour |
|---|---|---|---|
| RSI | Average gains vs average losses | 70 / 30 | Smoother momentum oscillator |
| StochRSI | Current RSI relative to recent RSI range | 80 / 20 | More sensitive; reaches extremes more often |
| Stochastic Oscillator | Current close relative to recent price high-low range | 80 / 20 | Measures price position inside its recent range |
How to Add Stochastic RSI to a TradingView Chart
- Open the currency pair and timeframe you want to analyse.
- Select Indicators on the chart toolbar.
- Search for “Stochastic RSI” or “Stoch RSI.”
- Choose the built-in indicator rather than an unverified community script when you are learning the standard formula.
- Open the settings panel and check the RSI length, Stochastic length, %K smoothing and %D smoothing.
- Keep price structure visible above the oscillator instead of analysing StochRSI in isolation.
The examples in this guide use original AAFX.io TradingView-style charts so the indicator, candlesticks, %K/%D lines and momentum zones are easy to read without third-party chart branding.
Best Stochastic RSI Settings
There is no single best setting for every pair, timeframe or strategy. The common 14,14,3,3 setup is a strong default because it provides smoothing without making the indicator too slow. Shorter settings react faster but can become extremely noisy.
| Setting style | Example | Behaviour | Main risk |
|---|---|---|---|
| Standard | 14 RSI / 14 Stoch / 3 K / 3 D | Balanced smoothing | Can still generate repeated signals in ranges |
| Faster | Shorter lookbacks or less smoothing | Earlier, more frequent signals | Noise and false crossovers |
| Slower | Longer lookbacks / more smoothing | Cleaner, fewer turns | Late confirmation |
Avoid choosing a setting because it perfectly captured the last EUR/USD swing. Test settings on a meaningful sample and include spreads, slippage and the market regime in the review.
How to Read Stochastic RSI: 80, 20 and the Midpoint
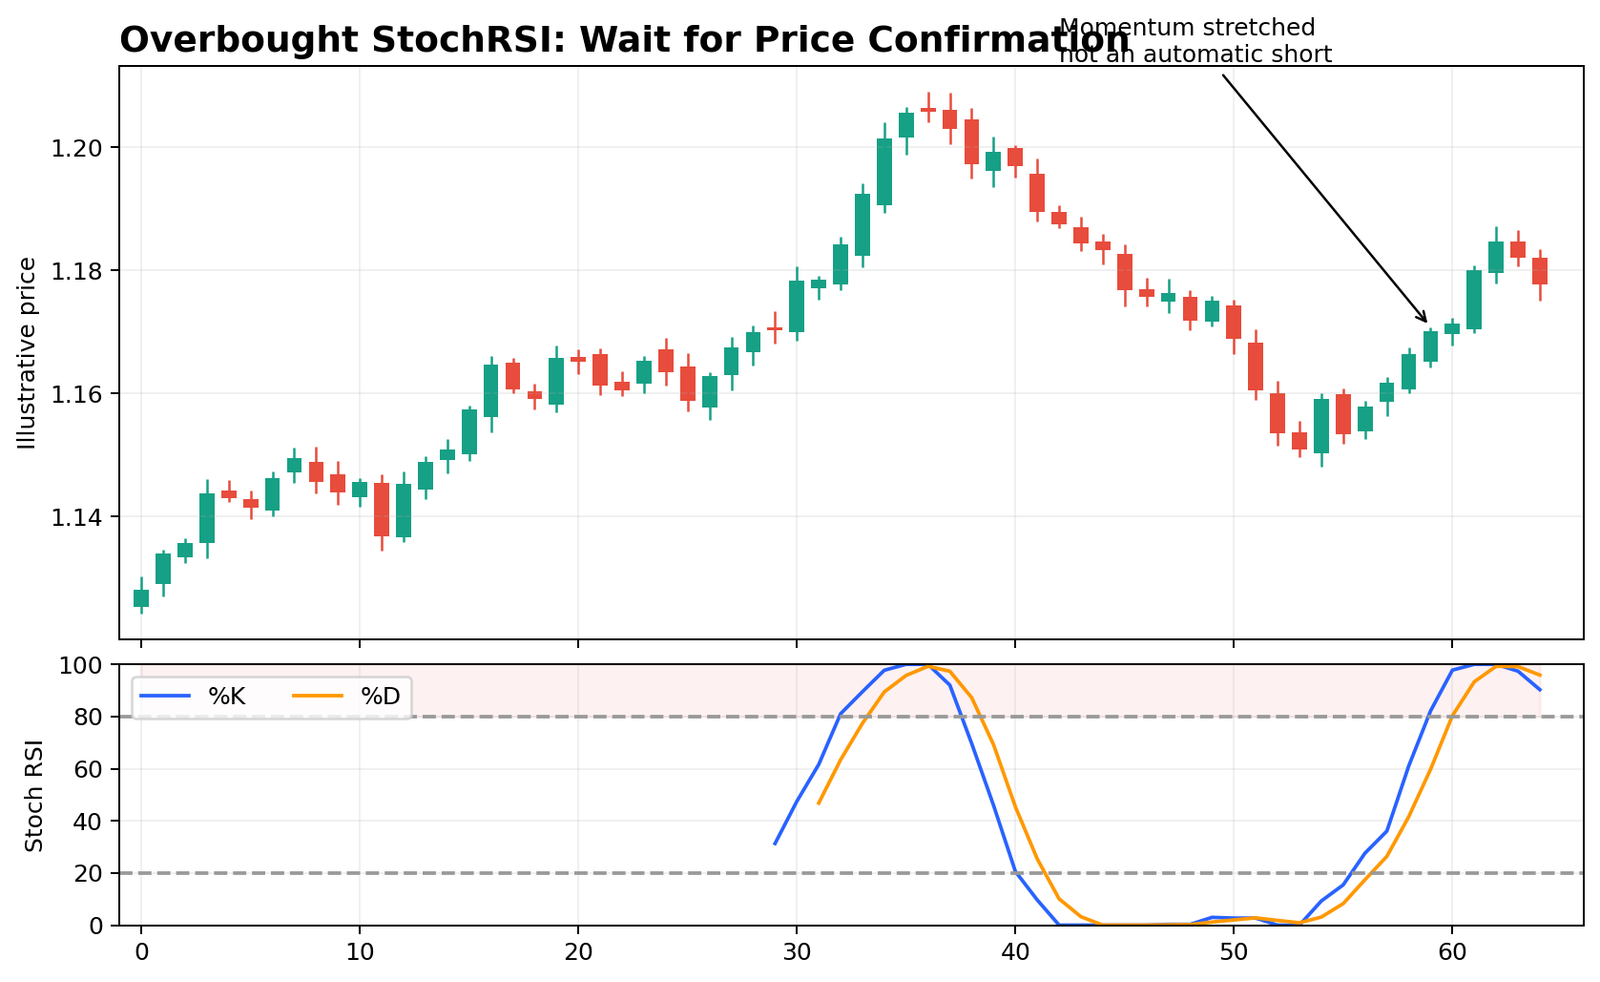
Above 80: Overbought Momentum
StochRSI above 80 means RSI is near the top of its recent range. This is commonly called overbought, but it does not mean price must fall. During a strong trend the oscillator can repeatedly reach 80-100 while price keeps advancing.
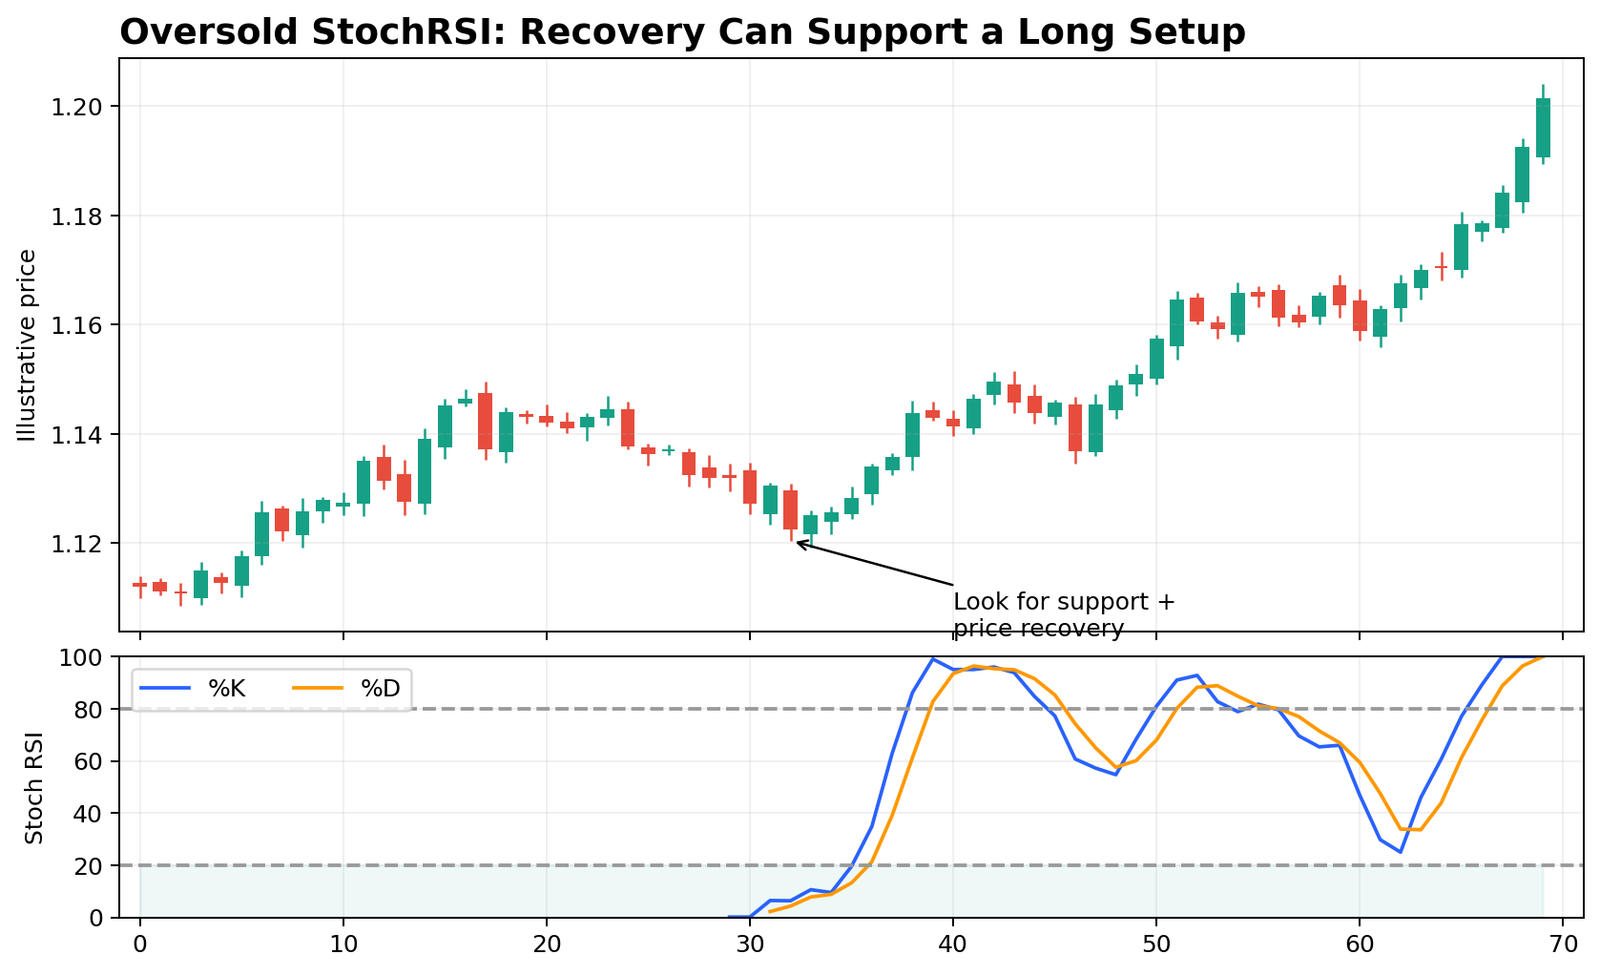
Below 20: Oversold Momentum
StochRSI below 20 means RSI is near the bottom of its recent range. It is traditionally oversold, but that does not guarantee a bounce. A recovery from below 20 becomes more useful when it occurs at support or during a pullback inside a larger uptrend.
The 50 Midpoint
The midpoint can provide an extra momentum reference. Movement above 50 suggests StochRSI has moved into the upper half of its recent range; below 50 places it in the lower half. The midpoint is secondary to the 80/20 zones and price structure, but it can help judge whether a momentum recovery is continuing.
%K and %D Crossovers
%K is the faster StochRSI line and %D is a smoothed signal line. A bullish crossover occurs when %K rises above %D; a bearish crossover occurs when %K falls below %D.
Crossovers become more useful when location and regime agree. A bullish crossover below or near 20 at established support can be more meaningful than the same crossover in the middle of a noisy range. A bearish crossover near 80 at resistance can be more useful than one that occurs while price is breaking to new highs in a strong trend.
Crossover Strategy: A Safer Process
- Identify whether the market is trending or ranging.
- Mark support, resistance or the pullback area before looking at the oscillator.
- Wait for %K/%D to cross in a location that fits the price setup.
- Use price confirmation such as a rejection candle, structure break or renewed trend movement.
- Place the stop according to price invalidation, not according to the oscillator level.
Stochastic RSI Divergence
Divergence occurs when price makes a new extreme but StochRSI does not confirm the move. Regular bullish divergence forms when price makes a lower low while the oscillator makes a higher low. Regular bearish divergence forms when price makes a higher high while the oscillator makes a lower high.
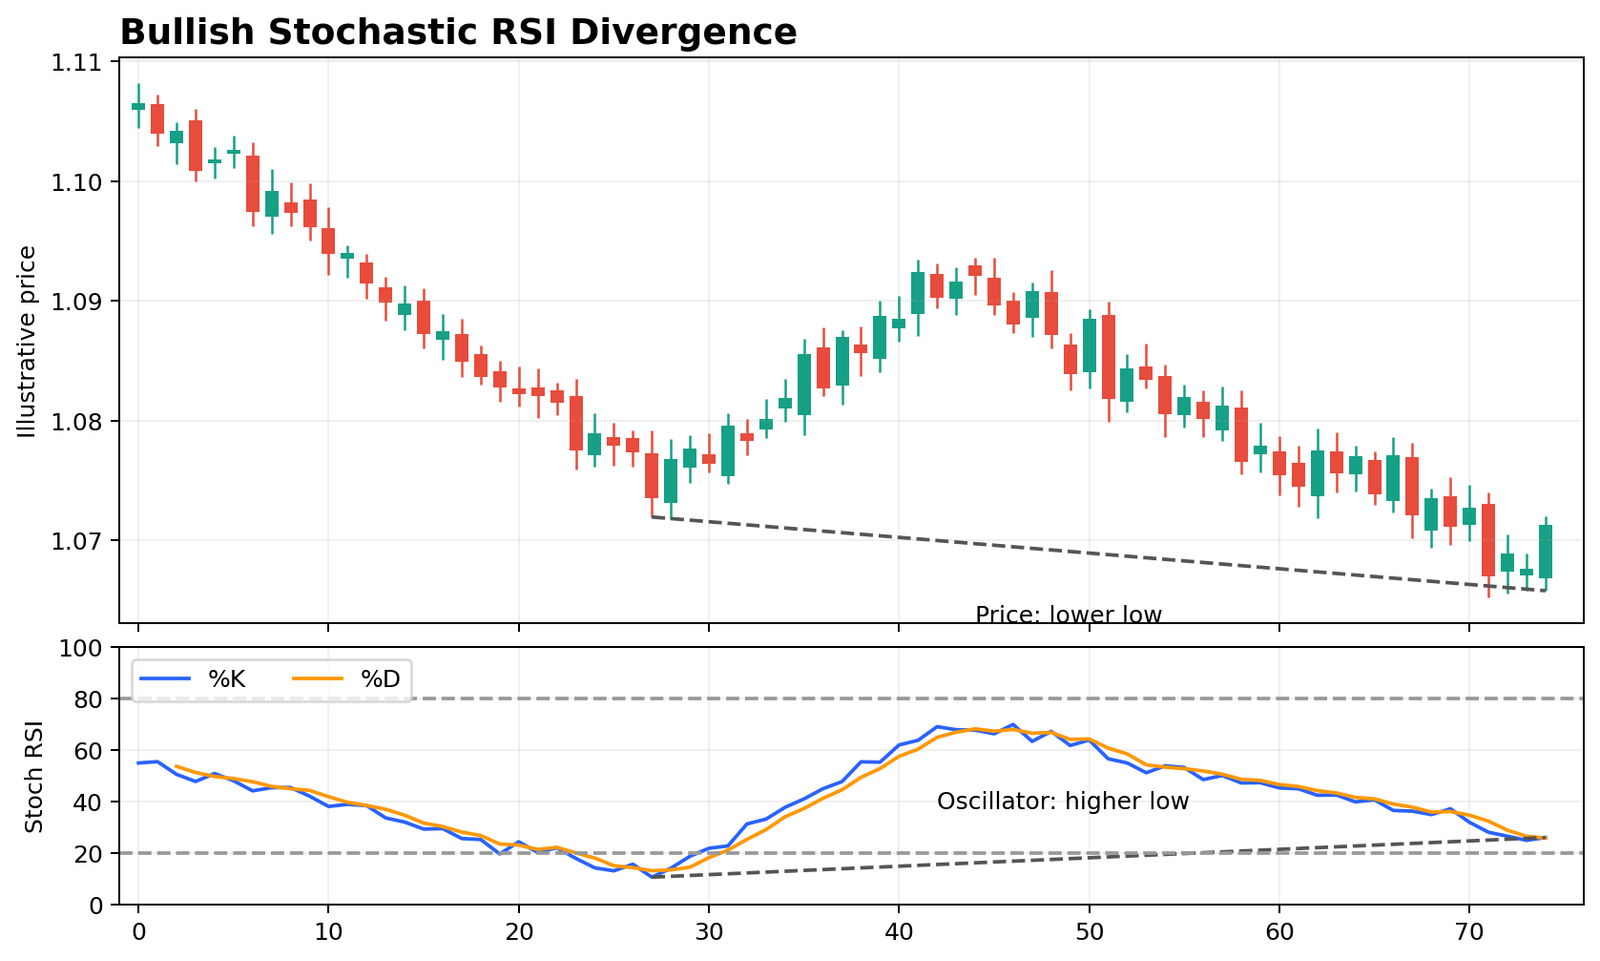
Divergence can appear early. Price may continue trending and create several divergences before reversing. Use divergence as a warning, then wait for price confirmation such as a break of structure or a failed retest.
Hidden Divergence
Hidden divergence is generally used as a continuation concept. Hidden bullish divergence appears when price makes a higher low while StochRSI makes a lower low. Hidden bearish divergence appears when price makes a lower high while the oscillator makes a higher high. These setups are most useful when the larger trend is already clear.
Practical Stochastic RSI Forex Strategies
1. Range Reversal Strategy
StochRSI is naturally suited to range trading because price repeatedly rotates between support and resistance. Look for an oversold reading and bullish crossover near range support, or an overbought reading and bearish crossover near resistance. The price level defines the setup; StochRSI helps time the momentum turn.
2. Trend Pullback Strategy
In an uptrend, wait for a pullback while StochRSI falls toward or below 20. A recovery and %K/%D bullish crossover can help identify renewed momentum if price also holds higher-timeframe support. In a downtrend, reverse the logic near resistance.
3. Divergence Reversal Strategy
Use divergence at a major swing level, then wait for price confirmation. A bullish divergence at support is not enough until price stops making lower lows or breaks a minor resistance level. This reduces the risk of fading a strong trend too early.
4. StochRSI + Moving Average
A moving average can define trend while StochRSI times pullbacks. For example, if EUR/USD remains above a rising 50-period average, StochRSI falling below 20 can be treated as a momentum reset rather than an automatic sign that the trend is finished. A bullish crossover after price holds above support can create better confluence.
5. StochRSI + Support and Resistance
Support/resistance often adds more value than stacking another oscillator. An oversold crossover at the middle of nowhere is weak; the same crossover at a repeatedly defended support zone is easier to structure with a clear invalidation level.
Stochastic RSI vs RSI: Which Is Better?
Neither is universally better. RSI is smoother and often easier for trend-regime and divergence analysis. StochRSI reacts faster and generates more short-term momentum signals. The best choice depends on how much sensitivity your strategy needs.
| Use case | RSI | Stochastic RSI |
|---|---|---|
| Trend context | Often better because it is smoother | Can be too sensitive |
| Short-term pullback timing | Useful but slower | Often more responsive |
| Divergence | Widely used | Also useful, but more frequent |
| Range extremes | Useful | Very responsive to rotations |
| Noise | Lower | Higher |
| Beginner simplicity | Easier | Requires understanding RSI plus stochastic logic |
Stochastic Oscillator vs RSI vs StochRSI: Do Not Mix Them Up
StochRSI, the standard Stochastic Oscillator and RSI are three separate indicators. Standard Stochastic works from the price range; RSI works from average gains and losses; StochRSI works from the range of RSI values. Keeping the names precise is important when adding the indicator to MT4, MT5, TradingView or another platform.
Stochastic RSI on Different Timeframes
| Trading style | Typical use | Main issue |
|---|---|---|
| Scalping | Fast momentum turns on 1m-15m charts | Extreme noise and spread sensitivity |
| Day trading | Pullbacks/crossovers on 5m-1H charts | Economic releases can overwhelm the signal |
| Swing trading | Momentum resets on 1H-4H/daily | Signals can remain extreme through strong trends |
| Position trading | Secondary timing tool on daily/weekly | May be too sensitive relative to macro holding period |
Limitations of Stochastic RSI
It is an indicator of an indicator
StochRSI is calculated from RSI, which is already calculated from price. The extra sensitivity is useful but can amplify noise.
It reaches extremes frequently
80/20 readings can occur repeatedly in strong trends or volatile markets.
Crossovers can whipsaw
%K and %D may cross several times in sideways conditions without producing a useful move.
Divergence can be early
Momentum can weaken well before price actually reverses.
Settings can be overfit
Changing lengths/smoothing to fit historical charts can make a strategy look stronger than it is.
It ignores macro event risk
A central-bank surprise or inflation release can invalidate a technically clean oscillator setup immediately.
How to Use Stochastic RSI in Forex: Step by Step
- Identify the higher-timeframe trend or range first.
- Mark support, resistance and the price level that would invalidate the setup.
- Start with a standard 14,14,3,3 StochRSI configuration unless you have tested another setting.
- Treat 80/20 as momentum zones rather than automatic entries.
- Use %K/%D crossovers as timing confirmation rather than as a complete strategy.
- Check divergence only at meaningful price swings.
- Confirm the oscillator signal with price action or trend structure.
- Check the economic calendar before trading a technical signal around major news.
- Calculate position size from the price stop, not from the StochRSI reading.
- Journal the setup so you can measure whether StochRSI actually improves the strategy.
Common Stochastic RSI Mistakes
- Confusing StochRSI with the standard Stochastic Oscillator.
- Buying every reading below 20 or selling every reading above 80.
- Trading every %K/%D crossover without checking market structure.
- Using a very fast setting simply because it gives more signals.
- Treating divergence as a guaranteed reversal.
- Ignoring the higher-timeframe trend.
- Adding RSI, StochRSI and Stochastic together and calling them three independent confirmations.
- Using the oscillator without a price-based stop and risk plan.
Frequently Asked Questions
What is Stochastic RSI?
Stochastic RSI is a momentum oscillator that measures where the current RSI sits within its recent RSI high-low range.
What is the difference between RSI and Stochastic RSI?
RSI compares average gains with average losses. StochRSI applies a Stochastic calculation to RSI values, making it more sensitive and faster-moving.
What are the best Stochastic RSI settings?
14,14,3,3 is a common default: 14-period RSI, 14-period Stochastic lookback, 3-period %K smoothing and 3-period %D smoothing. Other settings should be tested rather than assumed better.
Is Stochastic RSI below 20 a buy signal?
No. Below 20 means RSI is near the bottom of its recent range. It becomes more useful when the oscillator recovers and price confirms support or a trend pullback.
Is Stochastic RSI above 80 a sell signal?
No. Above 80 means momentum is near the top of its recent RSI range. Strong trends can remain overbought while price continues higher.
What do %K and %D mean in Stochastic RSI?
%K is the faster smoothed StochRSI line. %D is a further moving average of %K used as a signal line. Crossovers can show momentum shifts but also produce false signals.
Does Stochastic RSI work in forex?
It can be useful for timing momentum shifts, especially in ranges and pullbacks, but it should be combined with price structure, trend context and risk management.
Which is better: RSI or Stochastic RSI?
RSI is smoother and easier for broad momentum/trend analysis; StochRSI is more sensitive and can be better for short-term timing. Neither is universally better.
What is Stochastic RSI divergence?
It occurs when price makes a new high or low that the oscillator does not confirm. Divergence warns of weakening momentum but does not guarantee a reversal.
Can Stochastic RSI be used for scalping?
Yes, but low timeframes are noisy. Fast settings can create many false crossovers, and spread/slippage can dominate small targets.
Bottom Line
StochRSI is best understood as a faster momentum-timing tool built on top of RSI. Its 80/20 zones, %K/%D crossovers and divergence can help identify short-term momentum changes, but the indicator is deliberately sensitive and can generate many false signals.
The strongest use is to start with price structure, support/resistance and trend direction, then use StochRSI as confirmation or timing. AAFX.io’s RSI guide explains the underlying RSI in depth, while the Forex Technical Analysis pillar shows how StochRSI fits into the wider indicator framework. For a price-based range oscillator rather than one calculated from RSI, see the Williams %R guide.
AAFX.io, built around Arslan Ali Butt’s market-analysis and trading education, recommends testing oscillator rules over a meaningful sample and keeping position sizing and invalidation separate from the indicator itself.
Risk warning: Forex and leveraged derivatives involve substantial risk. StochRSI can produce false or early signals; news, gaps, spreads and slippage can invalidate technical setups. This article is educational, not personalised financial advice.
Sources & Methodology
Primary-source standard: Market-moving facts should link to original data releases, regulator notices, company filings or official project announcements whenever available. Secondary reporting is used for additional context, not as a substitute for original evidence.
Page last reviewed: