
WTI crude oil traded near $85.11 on Monday, consolidating after a strong weekly advance driven by persistent Middle East supply concerns. The U.S. benchmark remains less than 3% below its August peak of $87.69, but short-term momentum is weakening. On the five-hour chart, WTI remains comfortably above its 200-period simple moving average at $78.96, preserving the broader bullish structure. However, an RSI near 52, declining trading volume and a bearish MACD crossover indicate that buyers have lost some momentum as the market approaches major resistance.
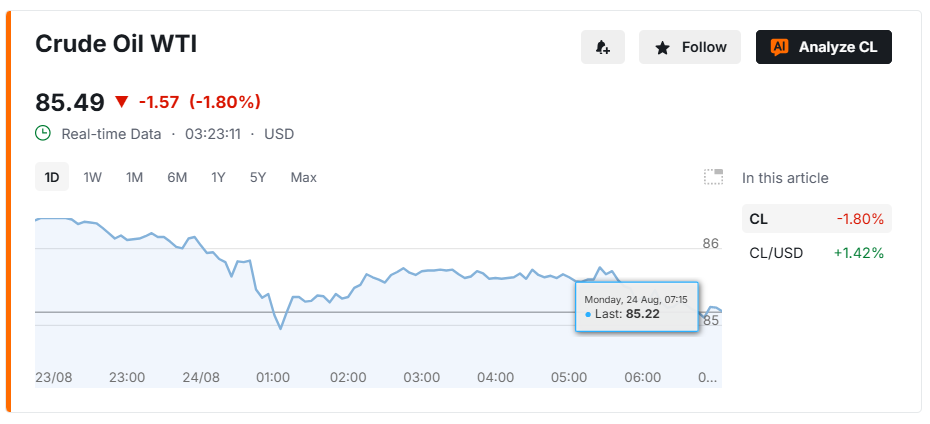
WTI Stalls Below $87.69 Resistance
WTI’s broader recovery remains intact despite Monday’s pullback. Oil finished Friday at $87.06 per barrel, gaining 5.66% for the week as stalled U.S.-Iran negotiations and continued disruption around the Strait of Hormuz increased concern about global supply. Brent crude ended the session at $94.39, up 6.39% for the week.
The rally pushed WTI as high as $87.69 on August 20, establishing the immediate resistance area now limiting further gains. Monday’s retreat toward $85 therefore represents consolidation below resistance rather than a confirmed reversal.
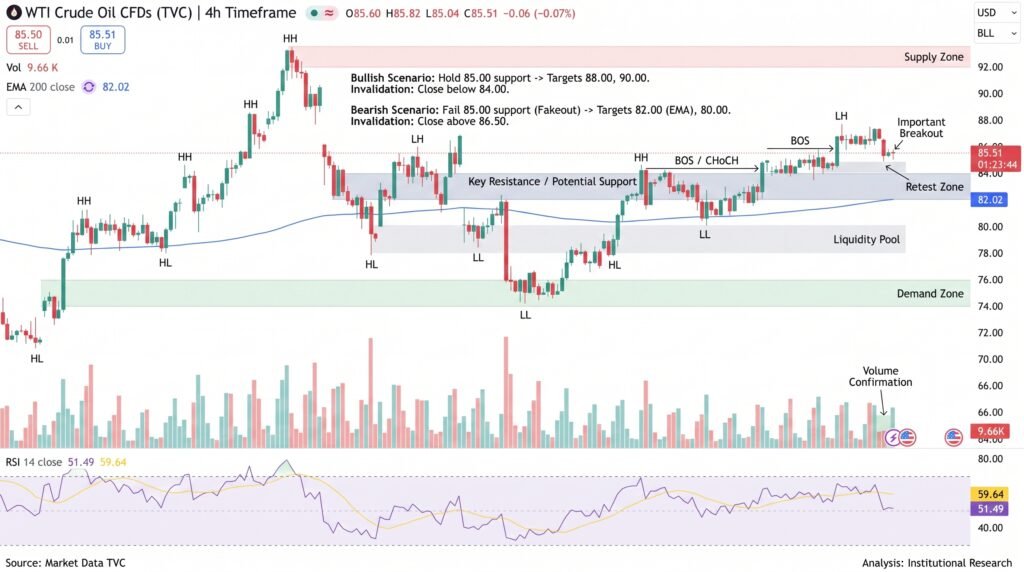
Technical momentum has nevertheless cooled. The five-hour Relative Strength Index is near 52, close to the neutral 50 level, while MACD has produced a bearish crossover. WTI has also formed lower highs after reaching $87.69. The combination suggests buying pressure has weakened, even though the longer-term trend remains positive.
$83.32 Support Becomes Critical
The immediate technical range is approximately $84.50-$86.50, where neither buyers nor sellers have established clear control. A break above this range would put $87.00-$87.69 back in focus. Confirmation would be stronger if accompanied by increasing volume and improving momentum rather than another brief move above resistance. On the downside, $83.32 is the more important level.
The current technical structure can be reduced to three areas:
- $87.00-$87.69: Primary resistance and recent peak.
- $84.50-$86.50: Current consolidation range.
- $83.32: Key trend support; a decisive break would weaken the bullish structure.
Below $83.32, attention would shift toward the 38.2% Fibonacci retracement around $79.80. That level is also relatively close to the 200-period SMA at $78.96, creating a deeper technical support region.
Iran Risk Keeps Oil Volatile
Technical consolidation is occurring against an unusually sensitive geopolitical backdrop. WTI dropped around 2% toward $85.32 on Monday as traders awaited details of a new U.S. sanctions package targeting Iran. Treasury Secretary Scott Bessent is expected to announce additional measures as Washington increases economic pressure on Tehran.
The decline may appear counterintuitive because tougher sanctions could restrict Iranian oil exports. However, prices had already risen strongly during the previous two weeks, encouraging some traders to reduce positions ahead of the announcement.
Supply conditions remain tight. Reuters reported that fewer than 20 commodity vessels crossed the Strait of Hormuz over the weekend, while Middle East exports remain disrupted. The strait remains crucial because disruptions there can affect crude and refined-product supplies reaching Asian markets.
U.S. inventories provide some counterweight. Commercial crude stocks recently increased by 4.4 million barrels to 428.8 million barrels, while refinery utilization reached approximately 97.2%, indicating exceptionally high processing activity.
Conclusion
WTI’s longer-term technical structure remains positive above the $78.96 200-period SMA, but momentum has clearly cooled after the move to $87.69. The immediate question is whether oil can escape the $84.50-$86.50 consolidation range. A sustained break above $87.69 would reinforce the bullish structure, while a move below $83.32 would expose the $79.80 region. With U.S.-Iran tensions, disrupted Hormuz shipping and high refinery utilization pulling against rising U.S. inventories, oil remains vulnerable to sharp moves in either direction. Until the current range breaks, consolidation remains the dominant technical condition.
Sources & Methodology
Primary-source standard: Market-moving facts should link to original data releases, regulator notices, company filings or official project announcements whenever available. Secondary reporting is used for additional context, not as a substitute for original evidence.
Page last reviewed: