
Natural gas is trading near $2.785 per MMBtu, trapped inside a narrow $2.756-$2.830 range on the five-hour chart. Short-term indicators have improved, with price holding above the 50-period moving average and the Ichimoku cloud, but the broader technical structure remains weak below the 200-period SMA near $2.890. The narrow range leaves $2.830 as the immediate breakout threshold and $2.756 as first support. Until either boundary breaks decisively, the market remains in consolidation rather than establishing a confirmed new trend.
$2.830 Caps Natural Gas Recovery
Natural gas has repeatedly struggled to establish a sustained move above the $2.800 area, turning the $2.785-$2.830 region into the immediate resistance zone.
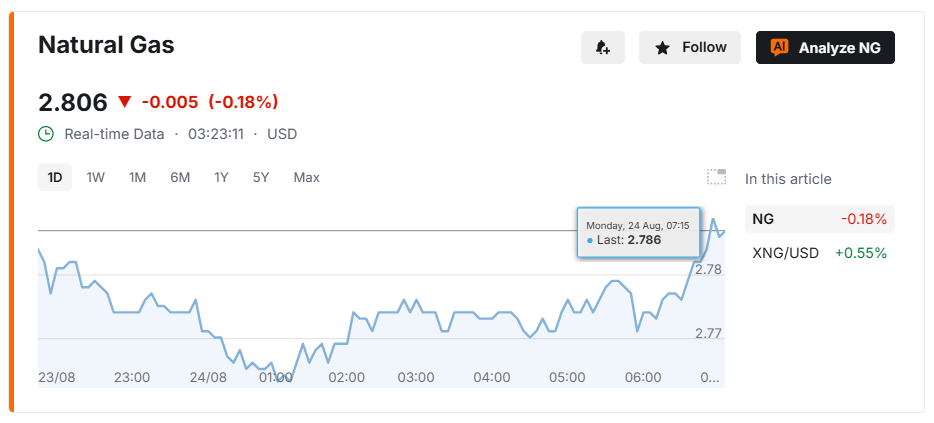
The latest five-hour candle also showed indecision around resistance, while fading volume suggests buyers have yet to establish sufficient momentum for a convincing breakout.
Short-term technical signals are nevertheless improving. Price has moved above its 50-period simple moving average and is trading above the Ichimoku cloud, while MACD momentum has strengthened.
The longer-term picture remains less constructive. Natural gas continues to trade below its 200-period SMA near $2.890. At a market price of $2.785, that places the contract roughly 3.6% below its long-term moving average.
The technical structure therefore shows a short-term recovery occurring within a broader bearish trend rather than a confirmed trend reversal.
$2.756-$2.830 Defines the Range
The clearest technical feature is the tight trading range between $2.756 and $2.830. At $2.785, natural gas sits almost directly in the middle of that range. This reduces the significance of small intraday moves because price remains surrounded by nearby support and resistance.
The main levels are:
- $2.830: Immediate breakout resistance.
- $2.800: Psychological and short-term resistance.
- $2.756: Primary range support.
- $2.890: 200-period SMA and major trend resistance.
A sustained close above $2.830, particularly alongside stronger trading volume, would provide better evidence that buyers have broken the existing range. Price would still need to confront the 200-period SMA near $2.890 before the broader bearish structure could materially improve.
Conversely, failure around $2.800-$2.830 followed by a move below $2.756 would confirm that resistance remains effective and weaken the short-term recovery.
Low Volatility Raises Breakout Risk
The five-hour Average True Range stands near $0.0348, equivalent to roughly 1.25% of the current natural-gas price. That relatively compressed volatility is consistent with the narrow trading range.
Low volatility itself does not predict whether the eventual move will be higher or lower. It simply shows that recent price swings have contracted. This makes confirmation particularly important because an initial move outside the range can reverse before a genuine trend develops.
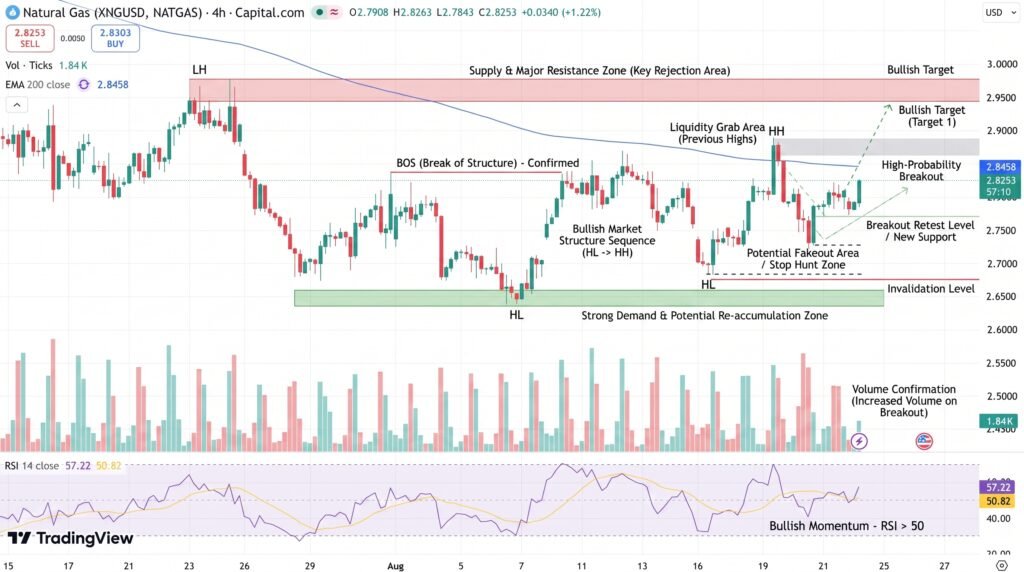
The fundamental market also remains sensitive to changing U.S. supply-and-demand conditions. Weekly storage figures from the U.S. Energy Information Administration remain one of the most closely watched indicators because inventory levels provide a direct measure of the balance between production and consumption.
Weather forecasts are equally important. Natural gas demand can change quickly as temperature expectations alter electricity demand for cooling or heating. LNG feedgas demand, domestic production and pipeline flows can further influence short-term pricing.
Conclusion
Natural gas remains technically confined between $2.756 support and $2.830 resistance, despite improving short-term momentum. Holding above the 50-period SMA and Ichimoku cloud supports the recovery, but trading below the $2.890 200-period SMA means the broader bearish structure has not been reversed. A confirmed close above $2.830 would strengthen the near-term outlook and shift attention toward $2.890. A break below $2.756 would instead reinforce downside pressure. Until one of those boundaries gives way, the five-hour chart remains a consolidation market where confirmation carries more weight than small moves inside the range.
Sources & Methodology
Primary-source standard: Market-moving facts should link to original data releases, regulator notices, company filings or official project announcements whenever available. Secondary reporting is used for additional context, not as a substitute for original evidence.
Page last reviewed: