Natural Gas is trading at 2.912 on the five-hour chart, a fraction below the 2.914 level marking the 38.2% Fibonacci retracement of its recent rally. Henry Hub futures have traded mostly between $2.74 and $2.91 this week, with record U.S. production near 111.5 billion cubic feet a day offsetting demand tied to Gulf Coast LNG exports and continued Middle East supply disruptions. Momentum indicators still favor buyers, but a doji candle forming right at resistance, paired with an RSI nearing overbought, signals hesitation at a key technical level.
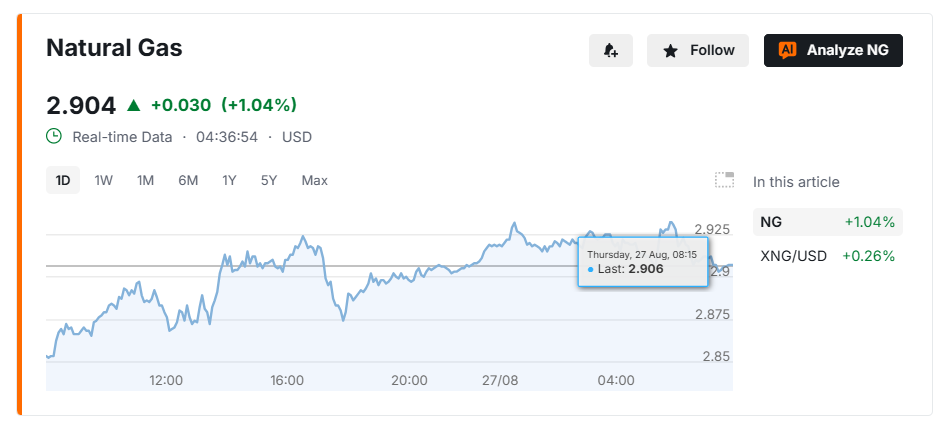
Resistance Squeeze in Action
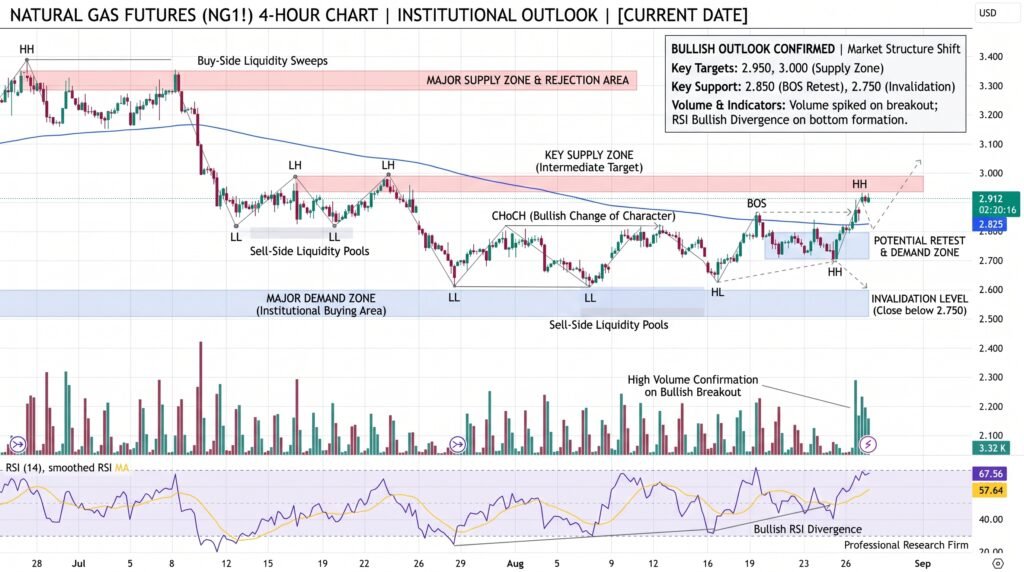
Price is testing the 2.914 Fibonacci mark directly, with the forming candle sitting at 2.912. Several momentum signals still favor the bulls: the MACD line holds above its trigger, price trades solidly above the 200-period simple moving average, and the market sits above the Ichimoku Cloud. Together, these suggest buyers retain near-term control.
The warning sign sits in the details. RSI at 67.55 is approaching overbought territory, and the candle at resistance closed as a doji — open and close prices landing almost level, a sign that neither buyers nor sellers currently have the upper hand. That combination, a stalled candle at a major Fibonacci level with RSI stretched, often precedes a pause or reversal rather than an immediate breakout.
- Resistance: 2.914 (Fibonacci), 2.950 (tested three times), 3.006 (next Fib level)
- Support: 2.862 (200-period SMA), 2.808 (SuperTrend base), with a heavy volume node between 2.800 and 2.900
Bulls vs. Bears at the Fib
For traders positioned long, chasing price at current levels carries real risk of buying right before a pullback. A better entry point is on a retracement rather than at resistance itself. Upside targets sit at 2.950, 3.006, and 3.100, with a stop below 2.780 to limit downside if the setup fails.
Bears have a narrower window. An aggressive short near 2.940 makes sense only if resistance holds, with a tight stop above the recent high of 2.990 and a first target at the rising 200-period moving average near 2.862. Between 2.880 and 2.940, the market is genuinely rangebound — entries inside that band tend to get caught by noise rather than direction, so waiting for a clear break is the more reliable approach.
Adding to the case for caution: the recent rally has completed what chartists call a V-bottom recovery, a full retrace back to prior levels. That kind of move frequently triggers profit-taking once it completes, which lines up with the stalling seen at 2.914 today.
Let the Market Show Its Hand
Volatility remains elevated, with the Average True Range at 0.0377, and volume is running high alongside it — a combination that raises the odds of a false move in either direction before the real trend asserts itself. A confirmed five-hour close above 2.950 would open the path toward 3.006 and 3.100. A slide back into the 2.880s would instead favor the short setup targeting 2.862.
The core lesson here is straightforward: when price reaches a major Fibonacci level, forms a doji, and RSI is pushing toward overbought all at once, the safer move is to wait for confirmation rather than anticipate the breakout or breakdown. Discipline around that confirmation matters more than getting the first move right.
Sources & Methodology
Primary-source standard: Market-moving facts should link to original data releases, regulator notices, company filings or official project announcements whenever available. Secondary reporting is used for additional context, not as a substitute for original evidence.
Page last reviewed: