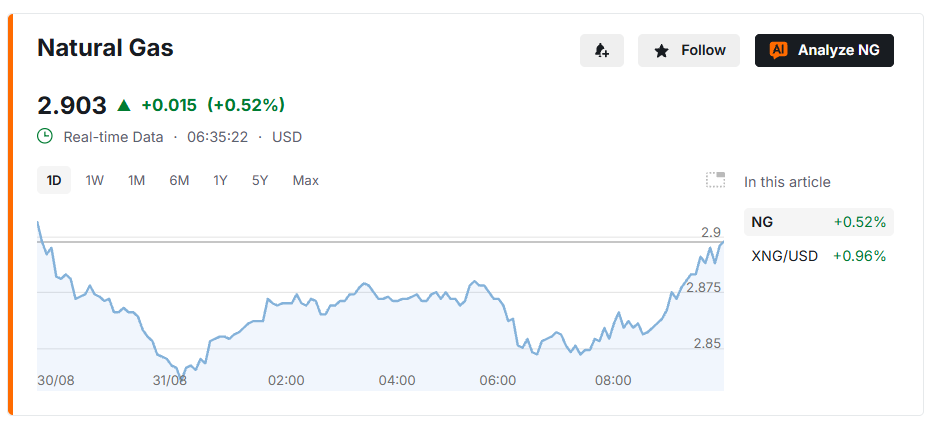
Natural Gas is trapped in a tight congestion zone on the 5-hour chart, pivoting at $2.878 and testing the patience of bulls and bears alike. Strong support sits near $2.800 to $2.900, but every rally has struggled to clear $2.990, making this a textbook indecision cycle where breakouts could reverse just as fast as they form.
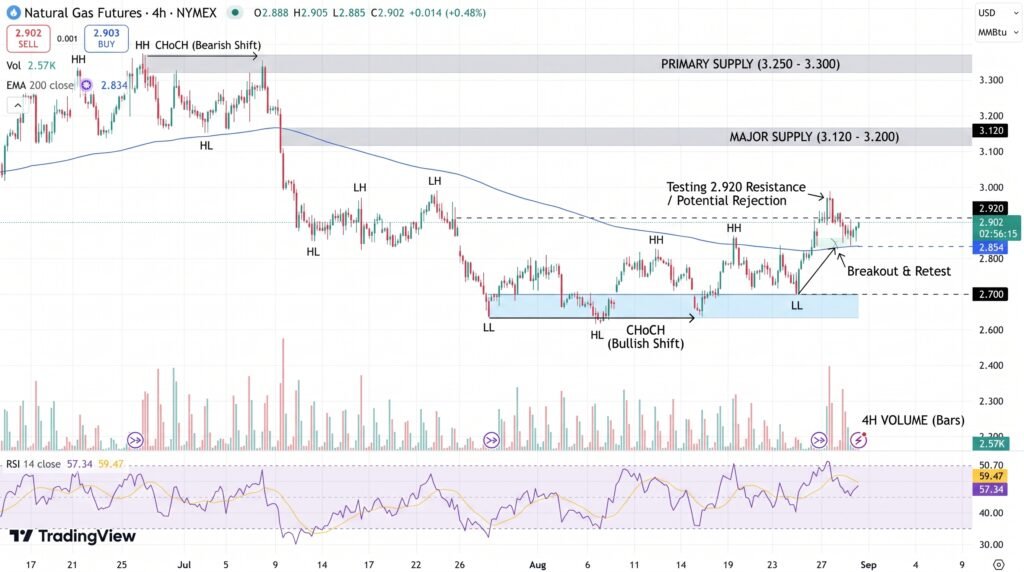
Price is currently locked inside a high-volume node between $2.800 and $2.900, and the underlying technicals are at a standoff. Bulls point to price holding above the 200-period simple moving average and a new SuperTrend support level at $2.811, a signal that often flags the start of a directional shift. Bears counter with fading momentum on the MACD, a stubborn Ichimoku cloud capping price near $2.889, and aggressive rejection wicks at $2.989 that point to real selling interest overhead.
Trade Scenarios for Both Sides
Tight stop placement is minimizing potential losses if price whipsaws inside the range. Risk-reward ratios start out reasonable, at 1.5 to 1 or better, but the strongest setups only emerge once a genuine breakout confirms above $2.990 for bulls or below $2.811 for bears. As long as price clings within the $2.811 to $2.950 chop zone, the more prudent approach is to wait, since false moves are especially common inside a dense volume node like this one.
Fibonacci and Pattern Signals to Watch
A rounding bottom pattern, a chart formation that often precedes a bullish reversal, appears roughly 80% complete, hinting at a latent upside push. Confirmation remains essential, though: jumping in too early risks buying into a bull trap, precisely what happened on August 27 when price was rejected near $2.989. Fibonacci resistance also lines up closely with heavy sell interest at $2.906 and again at $2.990. Adding to the caution, mean-reversion risk remains elevated, since breakouts above the cloud or volume node can reverse quickly if they are not backed by genuine volume expansion.
Key levels traders are tracking:
- $2.990: confirmed close above signals a bullish breakout
- $2.811: confirmed close below signals a bearish breakdown
- $2.811-$2.950: the chop zone where false breakouts are most common
The Discipline Behind This Setup
The $2.811 to $2.950 band is a textbook no-trade zone, the range where many traders get chopped up chasing moves that don’t hold. Waiting for a confirmed close above $2.990 or below $2.811 remains the more disciplined approach. Both bullish and bearish playbooks call for taking partial profits at the first target and moving stops to breakeven before riding any larger move. The lesson underneath it all: the best opportunities come from restraint, letting price tip its hand outside the congestion before committing capital. Rejection wicks and volume near key resistance and support levels remain the earliest warning signs of a coming reversal.
Sources & Methodology
Primary-source standard: Market-moving facts should link to original data releases, regulator notices, company filings or official project announcements whenever available. Secondary reporting is used for additional context, not as a substitute for original evidence.
Page last reviewed: