Crude Oil WTI is hovering around $94.01 on the five-hour chart, just below the recent $94.17 high. The sharp advance has pushed the RSI to 75.8, placing the benchmark deep into overbought territory and raising the risk of a pullback if buying momentum begins to stall.
The rally remains powerful, however. ADX at 31.34 confirms a strong underlying trend, meaning the elevated RSI should not automatically be interpreted as a reversal signal. Strong trends can remain overbought while prices continue to climb.
WTI is also trading 2.72% above its 20-period SMA, highlighting the extreme distance from its short-term average. Price has moved above the upper Bollinger Band at $93.51, another indication that the market has become significantly stretched.
The immediate technical battle is therefore between strong trend momentum and rising mean-reversion risk.
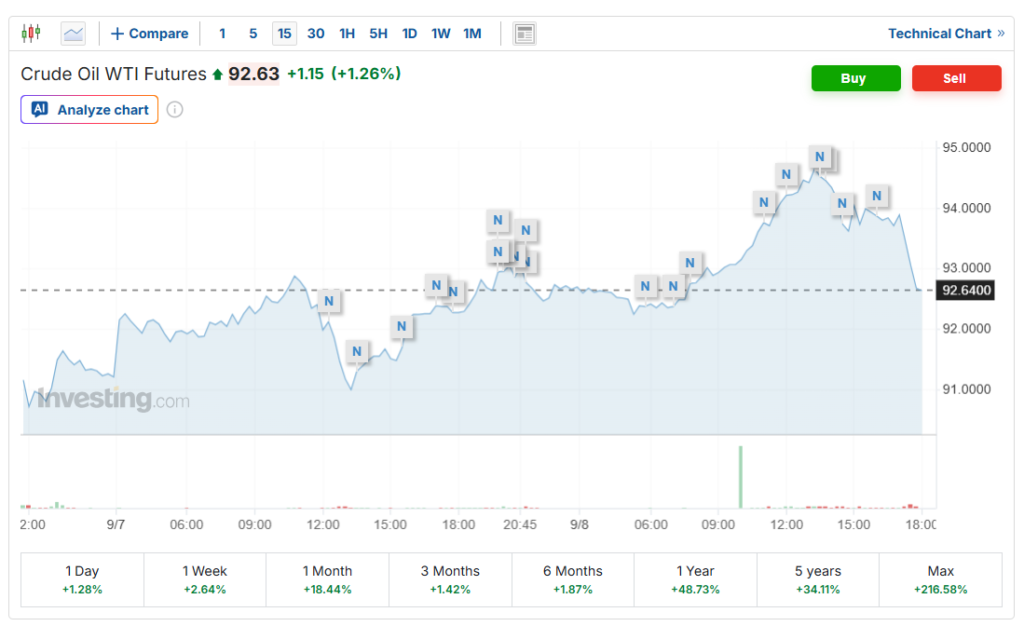
Source: investing.com
Overbought signals raise pullback risk
The 75.80 RSI is the clearest warning for late buyers. While an RSI above 70 indicates overbought conditions, the indicator alone does not confirm that a top is in place. With ADX above 30, sellers face the challenge of reversing a trend that still has substantial momentum.
The latest candle structure adds another layer of caution. A Marubozu candle near $94.17 reflects strong bullish conviction, but such extended candles can also appear near short-term exhaustion points after aggressive advances.
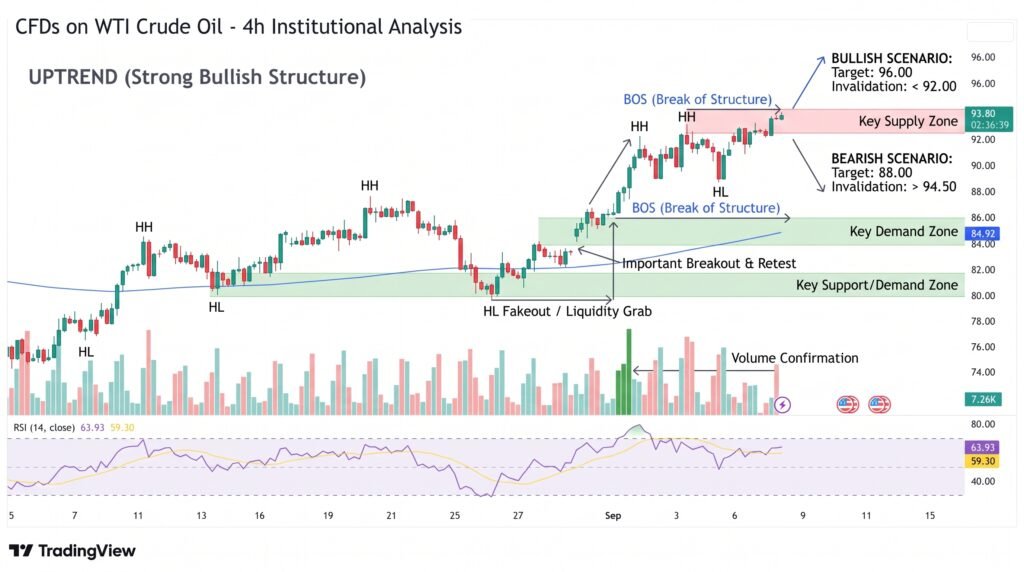
Key technical levels currently shaping the WTI price forecast include:
- $95.00: Major psychological resistance.
- $94.20–$95.50: Immediate overbought resistance zone.
- $91.68: Key dynamic support.
- $89.93: SuperTrend support.
- $87.25: SMA 50 and Fibonacci confluence.
The $91.70–$94.20 area remains a potential no-trade zone for traders looking for clean directional setups, as sharp moves in either direction could produce whipsaws.
Mean-reversion risk is also increasing. If bullish momentum fades, a pullback toward the 20-period SMA near $91.70 would represent a natural technical reset rather than necessarily signaling a broader trend reversal.
$91.70 break could trigger correction
The bullish scenario remains active while WTI holds above the key support structure. A sustained move through $94.20–$95.00 would strengthen the upside case and potentially expose $96, followed by $98 and the psychological $100 level.
However, chasing the rally at these elevated levels carries greater risk. The further price moves above its short-term averages, the more vulnerable the market becomes to a rapid correction if buying pressure suddenly disappears.
For bears, an immediate short position near $94.10 would be highly countertrend. A more conservative bearish signal would come from a confirmed break below $91.70, which would indicate that the parabolic advance is losing its immediate momentum.
A deeper decline below $89.93 would further weaken the short-term bullish structure, while the $87.25 SMA 50/Fibonacci confluence becomes an important lower support area.
The key scenarios are therefore:
- Above $95: Bulls could target $96, $98 and $100.
- $91.70–$94.20: High-risk consolidation and whipsaw zone.
- Below $91.70: Pullback risk increases significantly.
- Below $89.93: Short-term bullish structure weakens further.
Conclusion
WTI crude oil remains in a powerful uptrend, but the RSI at 75.8 signals that the rally has entered an extreme overbought phase. ADX at 31.34 confirms that momentum remains strong, while the 2.72% extension above the 20-period SMA and move above the $93.51 Bollinger Band highlight increasing overheating risk. A sustained break above $95 could open the way toward $96, $98 and $100, while a move below $91.70 would increase the probability of a correction toward $89.93 and $87.25. For now, the trend favors bulls, but chasing the parabolic move carries elevated reversal risk.
Sources & Methodology
Primary-source standard: Market-moving facts should link to original data releases, regulator notices, company filings or official project announcements whenever available. Secondary reporting is used for additional context, not as a substitute for original evidence.
Page last reviewed: