
WTI crude oil is holding near $103 a barrel after a rapid advance brought prices close to the recent $104.46 high, but the rally is showing signs of slowing. The supplied five-hour chart places WTI at $102.99, with fading momentum indicators and declining volume raising the risk of a short-term pullback.
The broader oil market remains supported by severe Middle East supply and shipping disruptions. Reuters reported Monday that WTI climbed to about $102.94, while Brent reached roughly $107.81, after renewed attacks disrupted energy infrastructure and intensified risks around major shipping routes.
Momentum Struggles Near Key Highs
WTI’s recent move has taken prices sharply above their short-term average. On the five-hour setup, crude was trading almost 10% above its 50-bar moving average, a pace that can leave markets vulnerable to abrupt profit-taking when buying pressure weakens.
The technical signals are no longer moving uniformly in favor of the bulls. The SuperTrend remains positive at $97.88, leaving that level as the most important dynamic support. However, the MACD histogram has slipped to 0.14, indicating that upside momentum is losing strength rather than accelerating.
The Relative Strength Index (RSI) stands at 69.49, just below the conventional 70 overbought threshold. RSI does not guarantee a decline, but at this level traders often watch for evidence that buying pressure is becoming exhausted.
A move back above $104.46 would restore the immediate bullish structure. Failure to clear that level, particularly with weaker volume, would increase the probability of consolidation.
Oil Supply Risks Keep Bulls Active
The technical setup is unfolding against an unusually tight geopolitical backdrop. Attacks on Saudi energy infrastructure and disruptions near the Strait of Hormuz and Bab el-Mandeb have increased concerns over the movement of Middle Eastern crude. Reuters reported that damage to Saudi Arabia’s East-West pipeline added another threat to global supply flows. That fundamental backdrop helps explain why buyers continue to defend elevated prices despite stretched technical readings.
U.S. supply growth provides an important counterweight. The Energy Information Administration expects American crude production to average a record 13.8 million barrels per day in 2026, supported largely by higher output from the Permian Basin and new Gulf projects.
Key factors traders are watching include:
- Middle East disruptions and tanker traffic.
- WTI’s ability to hold above $100.
- U.S. production growth and inventory trends.
WTI Levels Define the Next Move
The most important technical battleground is the $97.88–$98.50 zone, where the SuperTrend and 20-bar simple moving average provide a cluster of support. Holding that area would preserve the broader uptrend and give buyers another opportunity to challenge the recent high.
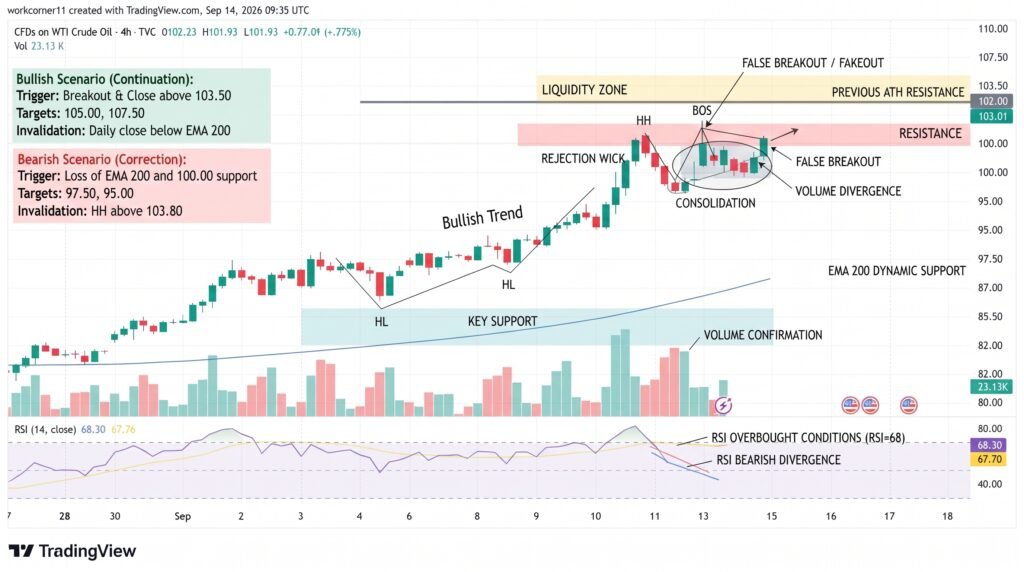
Above the market, the $103.50–$104.46 region remains the key resistance band. A decisive close above $104.46 would signal that the parabolic phase is extending and could attract momentum-driven buying.
The middle of the range is less attractive for directional trades. With volatility still elevated and the Average True Range (ATR) around 1.85, equivalent to roughly 1.8%, intraday moves can remain unusually fast.
A sustained break below $97.88 would materially weaken the bullish structure and open the door to a deeper mean-reversion move. Conversely, a breakout above $104.46 would shift attention toward fresh highs.
Conclusion
WTI’s rally remains fundamentally supported, but the technical picture has become more fragile near $104.46. RSI is approaching overbought territory, MACD momentum is fading and volume has weakened, while the market is still trading well above its short-term averages. The key test is therefore straightforward: $104.46 controls the breakout case, while $97.88–$98.50 defines the main downside defense. Until either zone breaks decisively, elevated volatility and sharp two-way moves remain likely.
Sources & Methodology
Primary-source standard: Market-moving facts should link to original data releases, regulator notices, company filings or official project announcements whenever available. Secondary reporting is used for additional context, not as a substitute for original evidence.
Page last reviewed: