
Bitcoin is trading in a narrow range between $76,400 support and $78,300 resistance, with the latest price near $77,246. The five-hour chart shows a market struggling to establish direction, while momentum indicators have tilted lower. A decisive break from this range could determine whether BTC extends its recent correction or attempts another recovery toward the $80,000 area.
The setup comes as Bitcoin faces a difficult macro backdrop. BTC fell about 2.2% on Tuesday, while U.S. Treasury yields moved sharply higher and the 10-year yield briefly exceeded 5%, reinforcing pressure on risk-sensitive assets.
Bitcoin Holds Critical Support
The immediate technical battle is centered near $76,400, where the supplied chart places the SuperTrend and 23.6% Fibonacci retracement in close alignment. That combination makes the zone particularly important for short-term traders.
Bitcoin’s latest five-hour candle closed around $77,246, only modestly above the lower boundary of the range. The 14-period RSI at 45.14 reflects weak but not oversold momentum, leaving room for either another decline or a technical rebound.
Bitcoin is also trading below key short-term resistance inside the range. If sellers fail to break $76,400, buyers could attempt to push the token back toward $78,300, where previous selling pressure has limited advances. The broader structure remains more constructive above the longer-term moving average:
- Range support: $76,400
- Range resistance: $78,300
- 200-period SMA: about $73,000
A sustained move through either boundary would provide a clearer signal than the current sideways trading.
Fed Outlook Raises Crypto Volatility
Bitcoin’s technical consolidation is occurring alongside a major monetary-policy event. The Federal Reserve is expected to announce its decision on September 16, with economists overwhelmingly forecasting a 25-basis-point rate increase after inflation proved more persistent than previously expected.
Interest-rate expectations matter for Bitcoin because tighter financial conditions can strengthen the dollar and push Treasury yields higher, reducing appetite for speculative assets.
That pressure intensified Tuesday. Reuters reported the U.S. 10-year Treasury yield rose above 5.02%, its highest level since 2007, while Brent crude climbed above $107 and WTI traded above $103 as Middle East supply risks intensified.
Yet Bitcoin has not lost all institutional support. Reuters reported that BTC rebounded from around $60,000 in late August, with options traders increasingly positioning for a move toward $80,000 or higher by December.
Breakout Levels Define Next Move
For bulls, the first requirement is a recovery above $78,300 with a strong five-hour close and improving trading volume. Such a move would weaken the immediate bearish structure and reopen the path toward $80,000, a major psychological level.
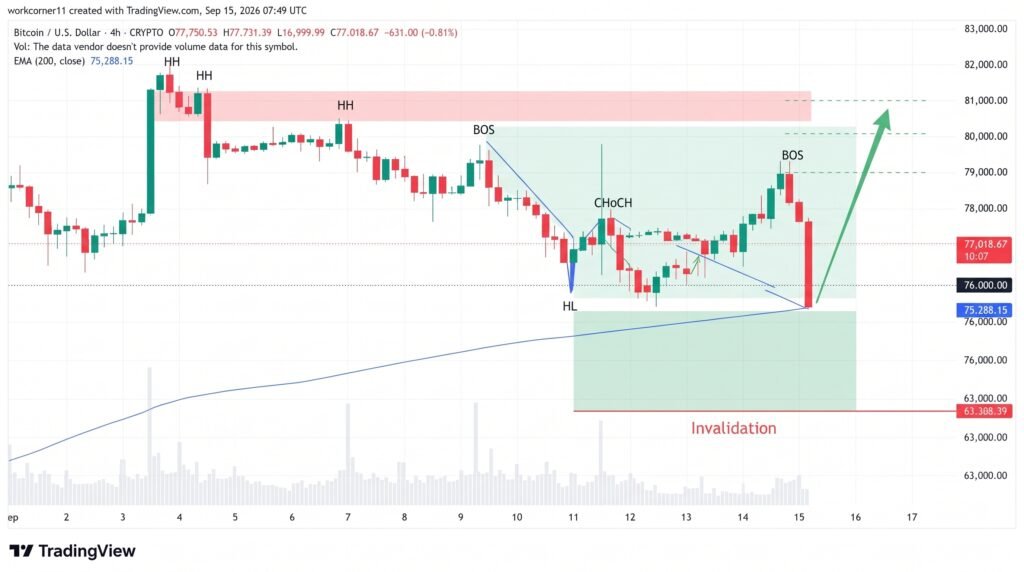
For bears, a clean close below $76,400 would confirm a breakdown from the current range. The supplied technical setup identifies the 200-period SMA near $73,000 as the first major downside objective.
A deeper deterioration could expose the $70,000 and $65,000 areas, although those targets would require stronger selling momentum and broader risk-off conditions.
The main signals are straightforward: RSI below 50 favors sellers, while a recovery above resistance would provide the first evidence that buyers are regaining control. Rising volume will also be important in distinguishing a genuine breakout from another short-lived move.
Conclusion
Bitcoin is trapped between $76,400 and $78,300, leaving the market vulnerable to a sharp move once one side gains control. The RSI near 45 points to weak momentum, while rising Treasury yields and expectations for a Fed rate hike add pressure to risk assets. A decisive break below $76,400 would expose the $73,000 200-period SMA, with $70,000 and $65,000 becoming deeper downside reference points. A break above $78,300, meanwhile, would restore bullish momentum and put $80,000 back in focus.
Sources & Methodology
Primary-source standard: Market-moving facts should link to original data releases, regulator notices, company filings or official project announcements whenever available. Secondary reporting is used for additional context, not as a substitute for original evidence.
Page last reviewed: