
Gold trades around $4,355.75 on the 5-hour chart, remaining under pressure as sellers test a key support structure near $4,320. The metal is trading below its 200-period Simple Moving Average (SMA) at $4,404.24, while the Ichimoku cloud between $4,375.07 and $4,381.05 adds another layer of overhead resistance.
The broader market backdrop remains challenging for bullion. Gold fell on Tuesday as expectations for elevated interest rates increased, with investors watching Federal Reserve officials for signals on the path of monetary policy. Spot gold was recently reported around $4,319 per ounce, while US gold futures were near $4,356.
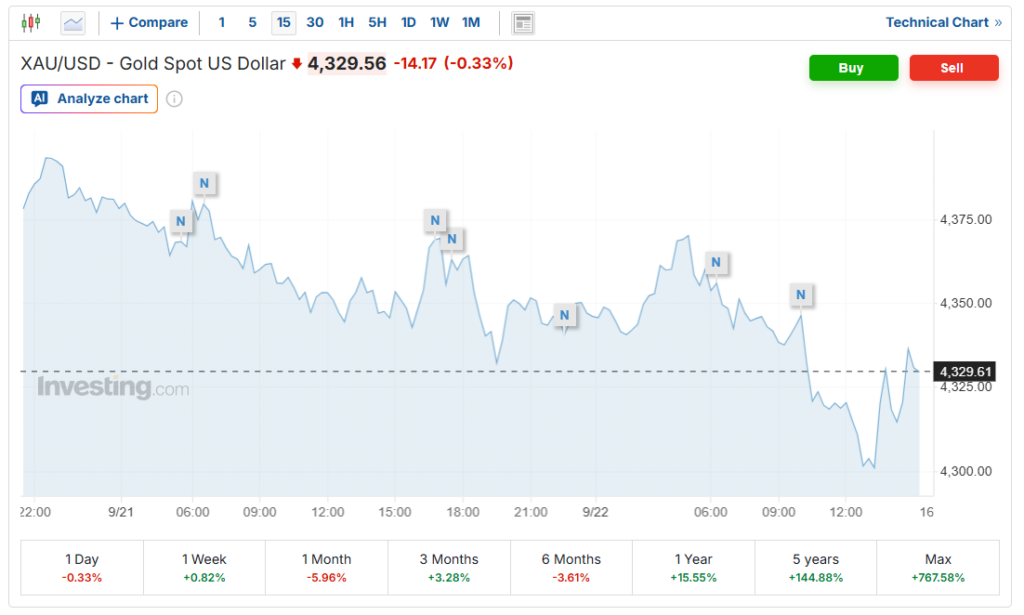
A decisive break below $4,320 would weaken the current support structure and expose lower technical levels. Until then, gold remains caught between fragile support and substantial overhead resistance.
Bearish Momentum Faces Weak Conviction
The 5-hour technical setup continues to favor sellers, although the lack of a strong trend leaves room for sharp reversals.
The main signals include:
- 200-period SMA: $4,404.24
- Ichimoku cloud: $4,375.07-$4,381.05
- Structural support: $4,320
- Bollinger lower band: $4,322.74
- MACD: 0.60 versus 3.19 signal
- ADX: 11.06
- MFI: 50.03
The negative MACD configuration indicates that downside momentum remains active, while price trading below the major moving averages keeps the short-term structure bearish. However, an ADX reading of 11.06 points to limited trend strength, meaning sellers have not yet established a high-conviction move.
Gold’s recent weakness also reflects the pressure created by higher-for-longer US interest-rate expectations. A stronger rate environment can reduce the relative appeal of non-yielding bullion.
$4,320 Break Could Open $4,260
The $4,320 level is the key technical line for the current setup. The area has been tested repeatedly, making a confirmed break particularly important for the next directional move.
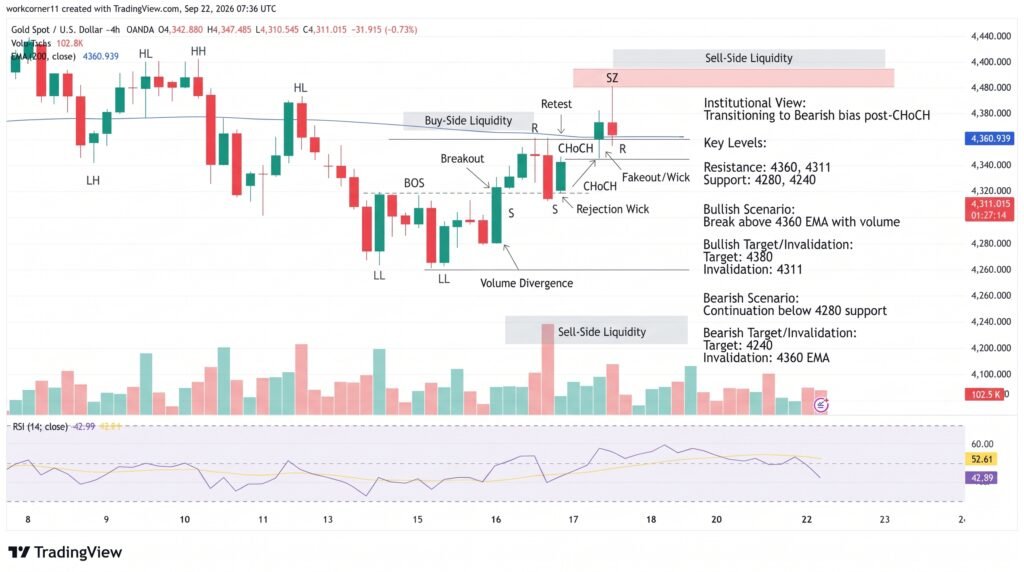
GOLD Price Chart – Source: Tradingview
A sustained move below $4,320 could expose $4,260 as the first major downside reference. Conversely, a recovery from the $4,320-$4,323 area would need to clear the $4,375-$4,381 Ichimoku cloud before bulls could challenge the 200-SMA at $4,404.24.
The current $4,330-$4,380 area remains a high-noise zone where false breakouts can develop. Traders should therefore monitor momentum and confirmation rather than relying on a single intraday move.
A stronger trend signal could emerge if ADX moves above 20, while the ATR near 39.86 indicates that gold can still produce relatively large short-term price swings.
Conclusion
Gold remains under pressure below the 200-SMA at $4,404.24, with $4,320 acting as the critical downside trigger. A confirmed break below that support could expose $4,260, while a recovery would first need to clear the $4,375-$4,381 Ichimoku cloud and then $4,404.24. Weak ADX readings suggest limited trend conviction, keeping the risk of false breaks elevated around the current support zone.
Sources & Methodology
Primary-source standard: Market-moving facts should link to original data releases, regulator notices, company filings or official project announcements whenever available. Secondary reporting is used for additional context, not as a substitute for original evidence.
Page last reviewed: