
Zcash is holding near $1,400 on Wednesday after three consecutive sessions of losses erased roughly 15% from its recent value. The privacy-focused cryptocurrency is consolidating after a sharp rally, while a deterioration in recent exchange-traded fund flows adds another factor for traders watching the next move.
Market data showed ZEC around $1,400.53 after falling 5.59% on September 29, with the session ranging from roughly $1,360 to $1,489. The retreat has brought the $1,300 area back into focus as an important technical support zone.
The decline also follows a sharp move higher earlier in September, leaving the market vulnerable to additional profit-taking if buyers fail to regain control.
ZCSH Split Arrives as Flows Slow
Grayscale’s Zcash ETF, which trades under the ticker ZCSH on NYSE Arca, completed its scheduled 3-for-1 forward share split on September 30. Shareholders of record received two additional shares for each share held, while the value of their overall investment was not changed by the split itself.
The split followed strong demand for the fund during its first month of trading. Reports said ZCSH had attracted more than $233 million in cumulative inflows by September 18, while assets reached roughly $890 million.
However, the latest flow data cited by FXStreet showed $8.12 million in outflows on Monday and zero inflows on Tuesday, indicating that institutional demand had temporarily weakened ahead of the split.
Key levels now include:
- $1,300: Primary downside support zone.
- $1,425: 100-period EMA and first resistance.
- $1,494: 50-period EMA and stronger resistance.
Technical Setup Points to $1,300
On the four-hour chart, ZEC remains below the 50-period EMA at $1,494 and the 100-period EMA at $1,425. The 200-period EMA at $1,254 remains below the market and provides longer-term technical support.
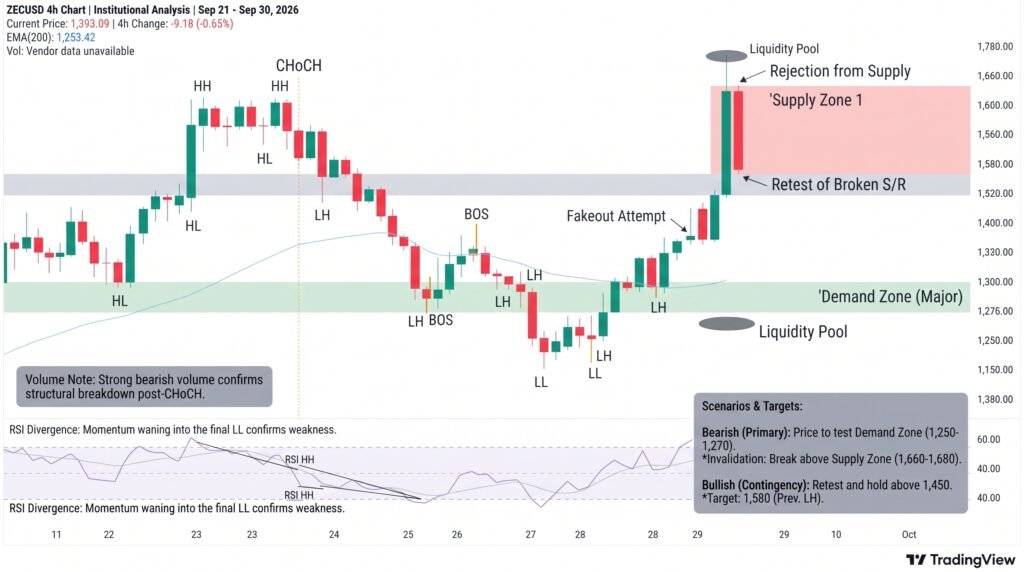
The MACD remains in negative territory, while the Relative Strength Index (RSI) is around 41, showing subdued buying momentum without reaching deeply oversold territory.
The immediate downside target is near the September 9 high of $1,296, closely aligned with the psychological $1,300 level. A sustained break below that area could bring the 200-period EMA near $1,254 into focus.
On the upside, reclaiming $1,425 would improve the short-term structure, while a move above $1,494 could open the way toward the September 23 high near $1,679.
Conclusion
Zcash remains under short-term selling pressure after its 15% three-session decline, with weakening recent ETF flows adding to the cautious backdrop. The $1,300 support zone is now critical, while the $1,425 and $1,494 EMA levels define the main recovery barriers. Holding above $1,300 could stabilize the pullback, but a decisive break below it would bring the $1,254 200-period EMA into focus. Meanwhile, the ZCSH split changes the ETF’s share count and price per share, not the underlying value held by shareholders.
Sources & Methodology
Primary-source standard: Market-moving facts should link to original data releases, regulator notices, company filings or official project announcements whenever available. Secondary reporting is used for additional context, not as a substitute for original evidence.
Page last reviewed: