
Bitcoin is testing a critical support zone between $82,975 and $82,800, with its price hovering around $83,045 in the supplied five-hour chart snapshot. The cryptocurrency is struggling to maintain its recent upward structure as momentum weakens and trading activity slows. The next move may depend on whether buyers defend this support area or sellers push the market toward lower levels. Although the broader trend remains supported by the 200-period moving average, short-term indicators suggest that downside pressure remains present.
Bitcoin Bull Flag Faces Resistance
Bitcoin has traded within a relatively narrow range of $82,600 to $85,000 over the past 20 hours, according to the supplied technical data. This consolidation resembles a bull flag pattern, a chart formation that can signal a continuation of an existing uptrend following a strong advance. However, the pattern alone does not confirm an eventual breakout.
The $84,516 level has repeatedly limited recovery attempts, leaving Bitcoin below its 20-period Simple Moving Average (SMA). Momentum indicators also reflect caution. The MACD indicator stands at -135.9, while the Relative Strength Index (RSI) sits at 43, below the neutral 50 threshold.
Trading volume has declined, suggesting that neither buyers nor sellers have established decisive control. A recovery would require stronger buying activity and a sustained move above nearby resistance.
Key Bitcoin Support and Resistance Levels
The immediate focus remains the $82,975–$82,800 support zone. A successful defense could encourage a rebound, while a sustained break below support would increase the risk of a deeper correction.
Important technical levels include:
- Immediate Bitcoin support: $82,975–$82,800.
- Fibonacci retracement support cluster: $82,650–$82,800.
- Near-term Bitcoin resistance: $84,516.
- Major downside trigger: A sustained close below $81,500.
- Longer-term trend support: The 200-period SMA at $79,527.
- Risk-management reference: $81,521, based on the supplied 1.5-times Average True Range (ATR) calculation.
The $83,200–$84,500 region remains a potential consolidation zone where false breakouts and short-lived price movements could complicate trading decisions.
Momentum Signals and Downside Risks
Bitcoin’s broader technical structure remains supported by the 200-period SMA at $79,527, which sits below the current price in the supplied chart. However, that longer-term reference does not eliminate the possibility of further short-term losses.
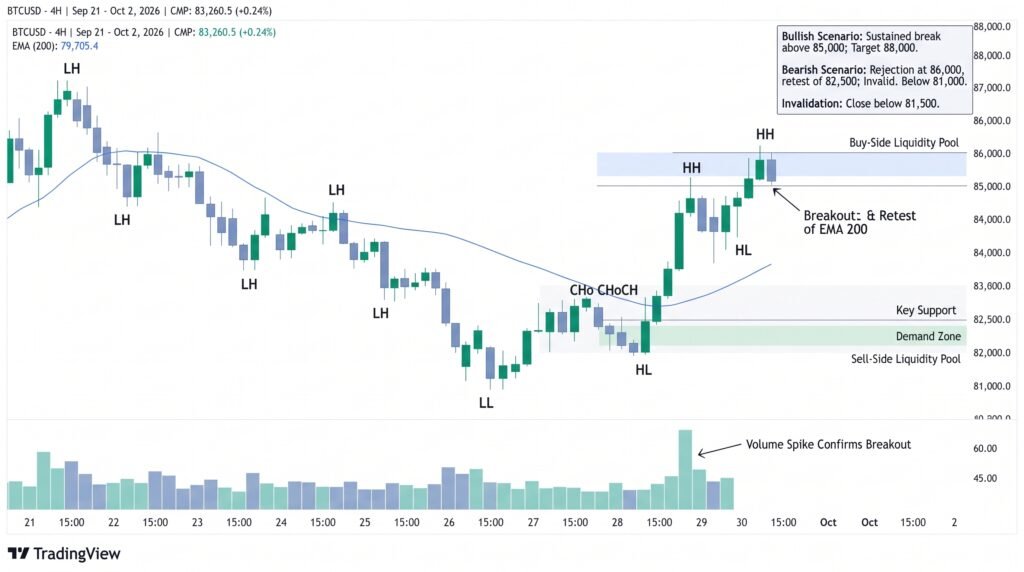
A sustained move below $81,500 could expose the psychological $80,000 level and potentially trigger additional selling if buyers fail to defend subsequent support. Conversely, a recovery above the 50-period SMA, followed by a break through $84,516, would provide evidence of improving short-term momentum.
Traders may monitor the following signals:
- Rising trading volume accompanying a move above resistance.
- A recovery in RSI toward or above 50.
- A positive MACD shift indicating improving momentum.
- A sustained hold above the $82,800 support area.
Conclusion
Bitcoin is approaching a key technical decision point as it tests support near $82,975. The bull flag structure offers a possible continuation scenario, but weakening momentum and resistance at $84,516 leave the short-term direction unresolved. A sustained breakdown below $81,500 could expose $80,000, while a recovery above resistance would improve the near-term technical picture. Traders should monitor volume, moving averages, and momentum indicators together rather than relying on a single price level. These figures reflect the supplied chart snapshot and should be checked against live market data before trading.
Sources & Methodology
Primary-source standard: Market-moving facts should link to original data releases, regulator notices, company filings or official project announcements whenever available. Secondary reporting is used for additional context, not as a substitute for original evidence.
Page last reviewed: