Silver is testing an important technical support area after a sharp decline from its recent $71.16 peak. On the five-hour chart, Silver is hovering around $61.41, keeping the market close to the 61.8% Fibonacci retracement at $61.17. Current market data also shows XAG/USD trading near $61.37 on Oct. 1, confirming that the metal remains close to the technical zone under scrutiny.
The setup leaves traders focused on whether $61.17 can hold. A sustained break below that level would weaken the short-term structure, while a rebound could bring resistance levels back into focus.
Silver Price Tests Fibonacci Support
The decline from $71.16 has kept the broader five-hour trend under pressure. Silver remains below the 50-period simple moving average at $64.29 and the 200-period SMA at $65.62, leaving both indicators above the current market price.
The 61.8% Fibonacci retracement at $61.17 is therefore the immediate technical reference. Fibonacci retracements are widely used to identify potential support and resistance after a significant price move. If buyers defend this level, silver could attempt a recovery toward the $63.12 SuperTrend level and the $64.29 moving average.
A deeper decline would put the descending channel’s $60.26 support into focus.
XAG/USD Momentum Favors Caution
Momentum indicators continue to reflect the recent weakness, although some signals suggest selling pressure may be losing intensity. The MACD remains negative, while the RSI is attempting to turn higher from oversold territory. That combination can appear during early stabilization, but it does not by itself confirm a trend reversal.
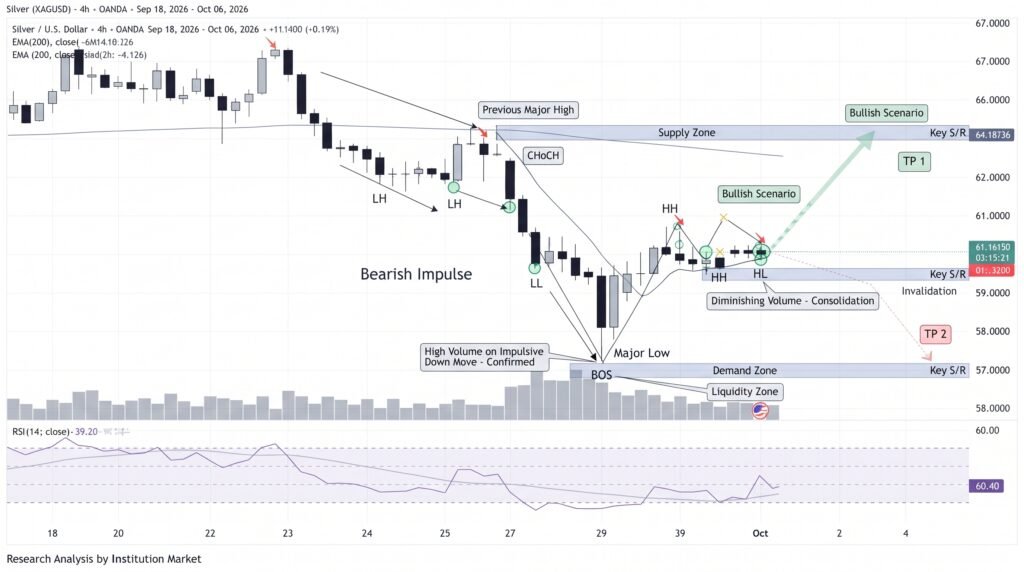
The Ichimoku Cloud and red SuperTrend near $63.12 remain overhead barriers. Price is also close to the lower Bollinger Band, reinforcing the importance of the current support area.
Key levels traders are watching include:
- $61.17: 61.8% Fibonacci support
- $60.26: Descending-channel support
- $63.12: SuperTrend resistance
- $64.29-$65.62: 50- and 200-period SMA resistance
Broader precious-metals trading also remains sensitive to U.S. interest-rate expectations, Treasury yields and the U.S. dollar. Reuters reported that spot silver was around $60.40 on Oct. 1, while markets awaited U.S. employment data and further Federal Reserve signals.
Conclusion:
Silver’s immediate direction depends heavily on the $61.17 Fibonacci level. Holding above it could allow a corrective rebound toward $63.12 and potentially $64.29, while a confirmed breakdown would expose $60.26 as the next major chart support.
For now, the technical structure remains bearish below the major moving averages, but the improving RSI means sellers are not facing a completely one-sided momentum picture. Traders may therefore treat $61.17-$63.12 as the critical decision range for the next move.
Sources & Methodology
Primary-source standard: Market-moving facts should link to original data releases, regulator notices, company filings or official project announcements whenever available. Secondary reporting is used for additional context, not as a substitute for original evidence.
Page last reviewed: