
Natural Gas is trading around $2.973 on the five-hour chart, putting the market directly above a critical $2.966 Fibonacci support level. The decline follows a double-top formation near $3.317 and a break below short-term moving-average support. Momentum remains negative, although deeply oversold conditions could increase the risk of a temporary rebound. Current technical data also places Natural Gas near $2.97, with $2.966 identified among the key Fibonacci and pivot levels.
Double Top Keeps Pressure on Gas
The double-top pattern around $3.317 marked an important reversal area. After failing to sustain the advance, Natural Gas moved below the 20-period SMA near $3.070, shifting short-term momentum toward sellers. The immediate technical question is whether $2.966 Fibonacci support can absorb the latest selling pressure.
A sustained break below that level would expose the next major downside reference near $2.884, corresponding to the 61.8% retracement. A further decline could bring the previous swing low around $2.790 into focus. By contrast, a rebound from $2.966 would put $3.010 and then the $3.070 area back on the radar.
Current technical readings remain weak. Investing.com’s latest snapshot shows RSI near 34, MACD around -0.017, and several momentum indicators in oversold territory. Its moving-average table also shows all major listed averages carrying sell signals.
Oversold Signals Meet Weak Momentum
The Money Flow Index at 18.84 in the supplied five-hour setup indicates heavy selling pressure and an oversold market. That does not guarantee a reversal, but it raises the probability of short-lived countertrend volatility if buyers defend $2.966.
Natural Gas is also trading below the Ichimoku Cloud near $3.067, while the supplied MACD reading shows the bearish momentum widening. Traders therefore have two conflicting signals: oversold conditions may support a bounce, while the broader technical structure continues to favor downside pressure.
Fundamentals add another layer. The U.S. Energy Information Administration reported that U.S. production increased about 2% during June-August 2026 from a year earlier. The agency also expects working gas inventories to reach about 3,969 Bcf by Oct. 31, roughly 5% above the previous five-year average.
$2.966 Break or Rebound Matters
The next move around $2.966 is therefore important for short-term chart structure. A confirmed break could open the path toward $2.884, while a successful defense could trigger a recovery toward $3.010 and $3.070.
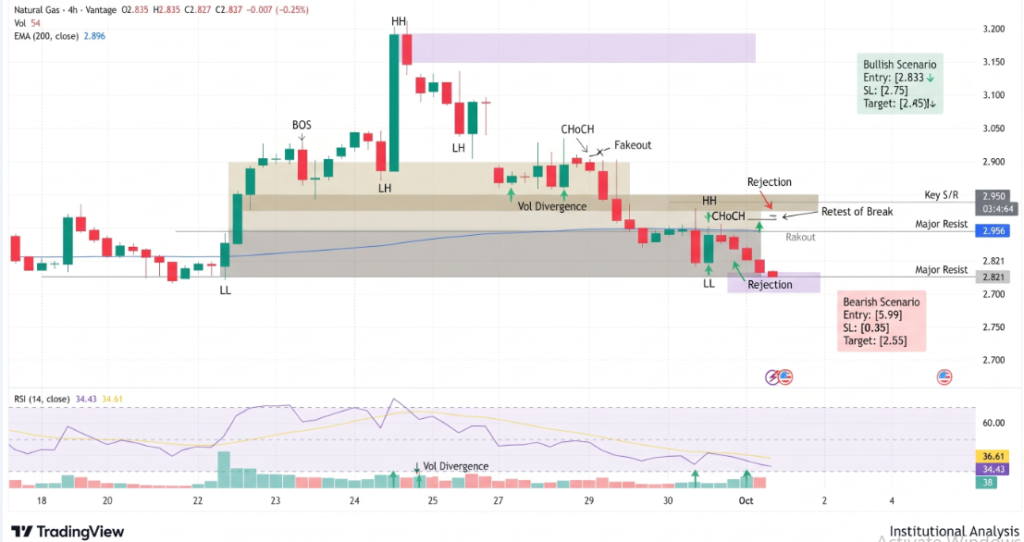
- Support: $2.966, then $2.884
- Resistance: $3.010 and $3.070
- Major downside reference: $2.790
- Key pattern: $3.317 double top
Conclusion
Natural Gas remains under technical pressure near $2.973, but $2.966 represents a closely watched support zone. Oversold momentum indicators could produce a rebound, while a decisive close below support would strengthen the bearish setup. With U.S. inventories projected above their five-year average heading into winter, fundamental supply conditions also remain an important factor.
Sources & Methodology
Primary-source standard: Market-moving facts should link to original data releases, regulator notices, company filings or official project announcements whenever available. Secondary reporting is used for additional context, not as a substitute for original evidence.
Page last reviewed: