
Bitcoin is trading around the $86,000 area after a strong start to October, but its latest technical structure shows a growing gap between bullish momentum and short-term exhaustion. Market data on Oct. 2 placed BTC/USD around $86,200-$86,700 on major feeds, while the session high approached $86,841.
The latest move follows a rebound from September’s $83,563 monthly close. Bitcoin also pushed above $85,000, a level that had repeatedly capped the market during the previous week.
That advance keeps the broader short-term structure constructive, but the reported 5-hour chart is showing signs that the rally may need to consolidate before attempting another leg higher.
Overbought Signals Raise Pullback Risk
The key warning comes from the combination of price extension and momentum indicators. Bitcoin remains above its 20-, 50- and 200-period moving averages, which generally indicates that the prevailing trend remains positive. However, the reported MACD reading of 298.94 shows strong upside momentum, while the Money Flow Index at 100 signals an extremely stretched buying condition.
The reported shooting star near $86,841 adds another short-term caution signal. This candlestick forms when buyers push prices higher but sellers return before the period closes, making confirmation important rather than treating the pattern alone as a reversal.
- BTC’s recent session high reached about $86,841.
- The September close was $83,563.
- Bitcoin has recently moved above the $85,000 area.
The setup therefore points to elevated volatility rather than a confirmed trend reversal.
$87,363 Resistance Keeps Bulls Tested
The technical structure also features an ascending triangle, with resistance concentrated around the recent $87,363 peak cited in the analysis. A sustained break above that area would place greater emphasis on whether buyers can maintain higher highs rather than immediately reversing back into the previous range.
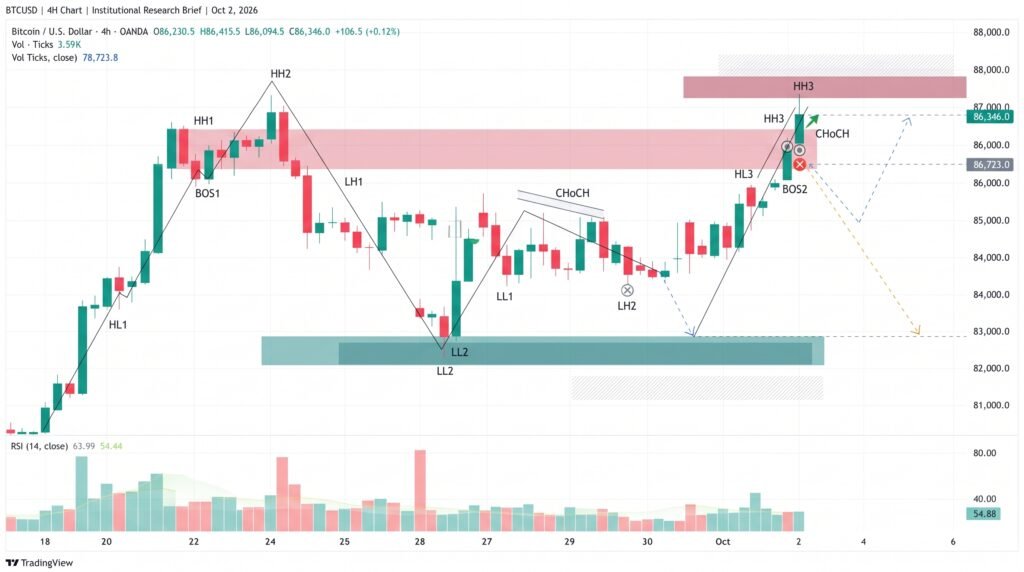
On the downside, $85,000 has become an important near-term reference after Bitcoin broke above that level. Broader technical analysis published at the start of October identified $82,000 as a significant support area and roughly $87,500 as a key upside threshold.
The reported $84,981 Fibonacci retracement level and $83,000 area therefore remain relevant if momentum fades.
Conclusion
Bitcoin’s structure remains supported by its position above major moving averages, but the reported 5-hour shooting star and extreme MFI reading show that momentum has become stretched. The immediate technical debate is centered on whether BTC can establish acceptance above the $86,000-$87,363 region or retreat toward $85,000 and lower support. A move beneath $83,000-$83,967 would materially weaken the current short-term bullish structure, while a sustained break above $87,363 would put the recent high back under scrutiny.
Sources & Methodology
Primary-source standard: Market-moving facts should link to original data releases, regulator notices, company filings or official project announcements whenever available. Secondary reporting is used for additional context, not as a substitute for original evidence.
Page last reviewed: