
Pi Network (PI) is trading near $0.0900 on Friday after falling almost 3% in the previous session, leaving the token vulnerable to another leg lower if key technical support fails. Market data shows PI briefly traded as low as $0.0891 on October 1 before stabilizing around the $0.0900 area.
The decline comes despite several recent ecosystem developments, including Pi Network’s reported partnership with Open Standard to explore OUSD stablecoin reward opportunities. PI is also approaching a period of protocol upgrades, adding another potential catalyst to the market’s near-term outlook.
PI Recovery Faces Fresh Selling Pressure
PI has struggled to establish a sustained recovery above the $0.1000 psychological threshold. The token’s latest retreat has brought price back toward a technically important area around $0.0900, where several moving averages are clustered on the four-hour chart.
The recent market structure remains defined by the recovery from the mid-September low near $0.0704. However, that rebound has developed within a rising-wedge formation, a pattern traders often monitor for a potential downside break when support gives way.
Pi Network’s ecosystem developments provide a fundamental backdrop, but they have not prevented renewed selling in the token. Current market data places PI around $0.0904, with a 24-hour range of approximately $0.0891 to $0.0919.
Key levels currently being monitored include:
- Immediate support: $0.0891-$0.0900
- Downside targets: $0.0844 and $0.0804
- Immediate resistance: $0.0902 and $0.0940
Technical Setup Points to $0.0844
On the four-hour chart, PI is trading close to its 50- and 100-period Exponential Moving Averages around $0.0900. The 200-period EMA near $0.0902 represents the first significant overhead barrier.
The Relative Strength Index is around 46, slightly below the neutral 50 mark, indicating that bullish momentum has weakened without reaching oversold conditions. Meanwhile, the MACD has moved marginally below zero, adding to the evidence that short-term momentum is losing strength.
The Fibonacci retracement at $0.0891 is particularly important because it overlaps with the rising support structure. A sustained break beneath this zone could expose the 23.6% retracement near $0.0844, followed by the previous month’s low around $0.0804.
$0.0946 Is Key for PI Recovery
A recovery above the 200-period EMA near $0.0902 would provide the first indication that buyers are attempting to regain control. The next obstacle sits around the upper trendline near $0.0940.
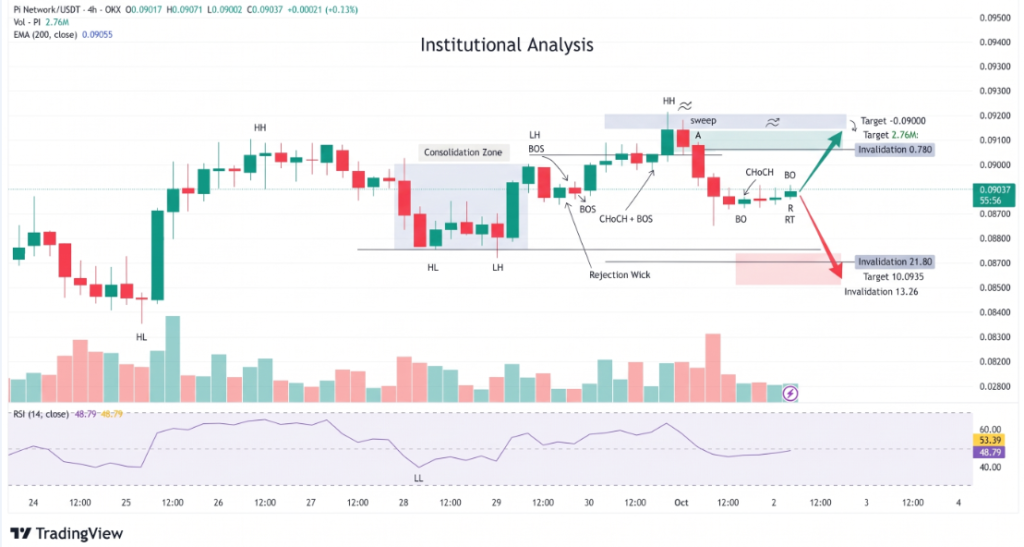
For the broader recovery structure to strengthen, PI would need to reclaim the 78.6% Fibonacci retracement near $0.0946. A sustained move above that level could shift attention toward the September swing high near $0.0989 and eventually the psychological $0.1000 barrier.
Conversely, rejection below $0.0940 followed by a break under $0.0891 would leave the lower Fibonacci levels exposed. Current market data shows PI remains far below its $2.99 all-time high, highlighting the scale of the longer-term decline despite the recent rebound.
Conclusion
Pi Network price is hovering near the critical $0.0900 area after a fresh pullback, with technical momentum showing signs of weakening. The $0.0891 support zone is the immediate test, while $0.0844 and $0.0804 become relevant if sellers force a breakdown. On the upside, PI needs to reclaim $0.0902, $0.0940 and ultimately $0.0946 to strengthen the recovery structure. The $0.0989 swing high remains the next major resistance before the psychological $0.1000 level.
Sources & Methodology
Primary-source standard: Market-moving facts should link to original data releases, regulator notices, company filings or official project announcements whenever available. Secondary reporting is used for additional context, not as a substitute for original evidence.
Page last reviewed: