Silver is trading around $61.40 on the five-hour chart, keeping the metal below a critical resistance band as a bearish consolidation pattern approaches a potential resolution. The market has stabilized after a sharp decline from $71.16, but sellers have yet to regain enough momentum to push price through the $60.26 floor. The developing bear flag is estimated to be about 80% complete, putting the $61.98-$62.11 zone at the center of the next technical move. Current spot-market data also places silver near $61.40 an ounce.
Silver Bear Flag Nears Resolution
Silver’s recent sideways action follows a steep decline from $71.16, creating the type of consolidation often associated with a bear flag. The pattern itself does not guarantee a downside breakout, but traders typically watch the lower boundary for confirmation rather than assuming the pattern will resolve in either direction.
At $61.40, price is attempting to stabilize around its short-term moving average. However, the broader technical structure remains under pressure because the SuperTrend indicator is positioned at $63.12 and the 50-period SMA stands near $63.90.
The setup is therefore defined by a narrow group of technical levels:
- Resistance: $61.98-$62.11
- SuperTrend: $63.12
- 50-SMA: $63.90
- Breakdown level: $60.26
A close above $62.11 would move silver beyond the immediate resistance cluster and weaken the near-term bearish structure. By contrast, a close below $60.26 would provide technical confirmation of a downside break from the consolidation.
Momentum Signals Show Mixed Pressure
Several indicators are giving different signals. The MACD has improved from -0.86 to -0.70, suggesting that downside momentum has moderated. The Relative Strength Index has also recovered to 43.83 after reaching oversold territory.
A doji around $61.425 adds another sign of short-term indecision. However, the price remains below the SuperTrend and 50-SMA, leaving the broader five-hour structure vulnerable if support fails.
The $61.18 area also deserves attention because it represents the stated 61.8% Fibonacci retracement level. That creates a technical confluence zone between the Fibonacci level and nearby price action.
Key Silver Levels for the Next Move
The $60.50-$61.98 area represents a broad congestion zone where repeated reversals could produce unreliable signals. The Average True Range is approximately $0.86 per five-hour candle, equivalent to roughly 1.4% of the current price.
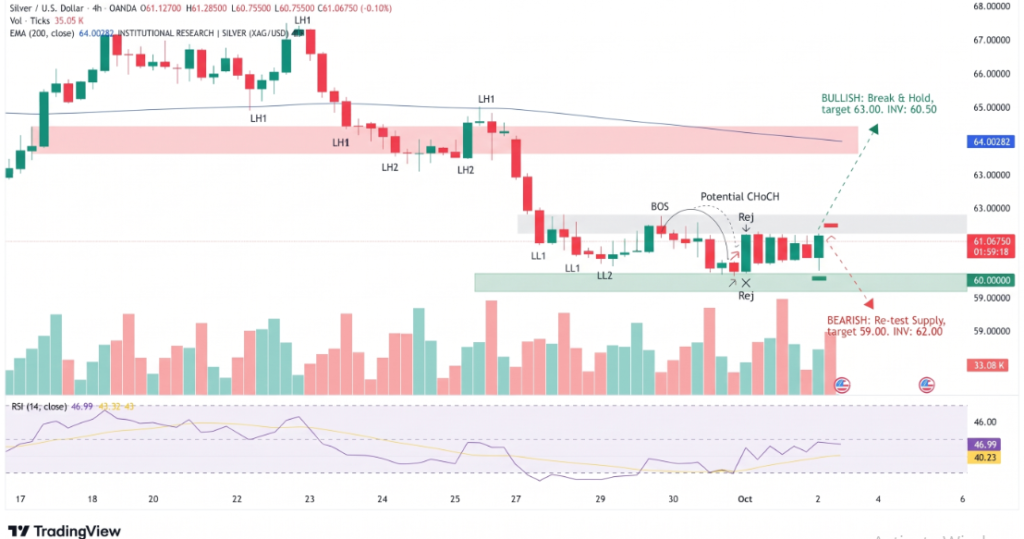
Silver Price Chart – Source: Tradingview
That volatility means a breakout could quickly extend beyond the initial technical level, while a false move remains possible around resistance.
Volume will also be important. Consolidation has occurred alongside softer trading activity, so a decisive move accompanied by stronger volume would provide greater confirmation than a low-volume price spike.
Conclusion
Silver remains trapped between fading bearish momentum and overhead resistance. The $61.98-$62.11 area is the immediate test for buyers, while $60.26 is the critical level for sellers. Improving MACD and RSI readings indicate that downside momentum has eased, but the SuperTrend and 50-SMA remain above price. A sustained move through $62.11 would challenge the bear-flag structure, while a confirmed break below $60.26 would strengthen the downside technical case.
Sources & Methodology
Primary-source standard: Market-moving facts should link to original data releases, regulator notices, company filings or official project announcements whenever available. Secondary reporting is used for additional context, not as a substitute for original evidence.
Page last reviewed: