
BNB is trading near $790 on Monday after three consecutive weekly gains, with derivatives data pointing to stronger bullish positioning. CoinGlass data shows BNB Open Interest (OI) has climbed sharply since mid-September, reaching 1.81 billion BNB, the highest level since early June. Rising OI alongside a higher price generally indicates that fresh positions are entering the market, giving bulls a stronger foundation.
The BNB derivatives market is also showing a positive funding rate. The rate turned positive on Saturday and reached 0.0093% on Monday, meaning long-position holders were paying shorts. While funding alone cannot confirm a sustained rally, the combination of rising OI, positive funding and recent price gains points to increased bullish participation.
BNB ETF Demand Remains Subdued
The derivatives strength contrasts with relatively limited demand through the spot BNB ETF market. VanEck’s BNB ETF launched on May 28 as the first U.S. exchange-traded product designed to provide spot exposure to BNB.
However, SoSoValue data cited by FXStreet indicates that BNB spot ETF flows have remained largely subdued since launch. The limited ETF activity suggests that the latest advance has been driven more heavily by derivatives traders than by sustained institutional spot demand.
That distinction matters because a rally supported mainly by leveraged positioning can become vulnerable if traders begin closing positions. A pickup in ETF inflows would provide a stronger confirmation that demand is broadening beyond the derivatives market.
$798 Breakout Opens Path to $826
Technically, BNB remains above its key medium- and long-term exponential moving averages, with the 50-day, 100-day and 200-day EMAs cited at $728, $689 and $679, respectively. That structure keeps the broader bullish setup intact despite Monday’s modest pullback.
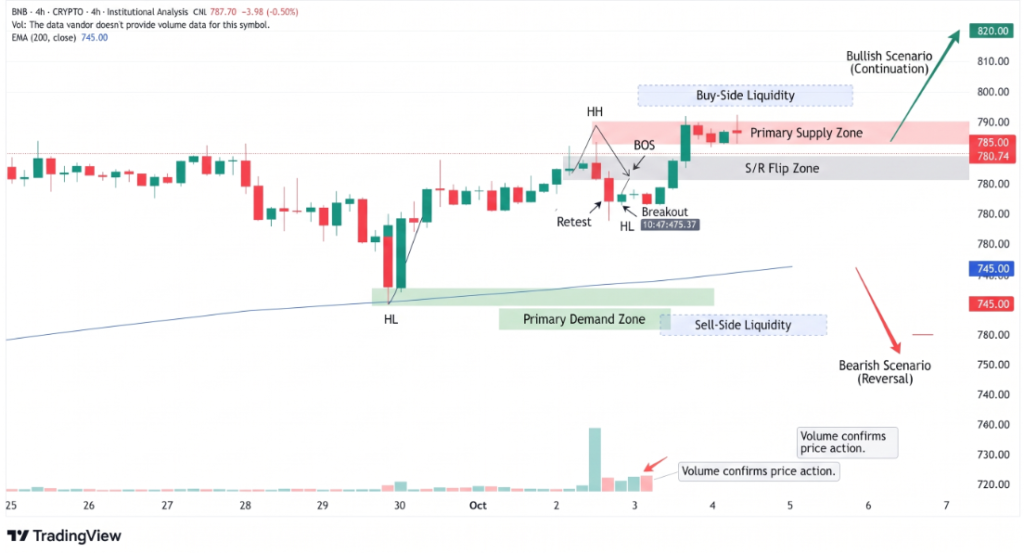
BNB is consolidating below the 61.8% Fibonacci retracement at $798, making that level the immediate test for buyers. The Relative Strength Index (RSI) near 61 remains bullish without entering overbought territory, while the MACD is slightly negative, showing that momentum has not yet accelerated decisively.
Key levels to watch are:
- $798: Immediate Fibonacci resistance.
- $826: Next horizontal upside target after a confirmed breakout.
- $758: Initial support on a pullback.
- $748: 50% Fibonacci retracement.
- $728: 50-day EMA and deeper support.
- $959: Major cycle-high objective.
A sustained close above $798 would strengthen the bullish case and expose BNB to $826. A move beyond that resistance would bring the previous $959 cycle high back into focus. Conversely, a break below $758 would weaken the immediate setup and increase the probability of a deeper retracement toward $748 and $728.
Conclusion
BNB’s current structure remains constructive, but the rally is being supported more clearly by derivatives than by institutional spot flows. Open Interest at 1.81 billion BNB and a positive 0.0093% funding rate show that bullish positioning has increased. The critical technical hurdle is $798. A decisive break above it could extend the advance toward $826, while failure to clear resistance would leave BNB vulnerable to a pullback toward $758 and $748.
Sources & Methodology
Primary-source standard: Market-moving facts should link to original data releases, regulator notices, company filings or official project announcements whenever available. Secondary reporting is used for additional context, not as a substitute for original evidence.
Page last reviewed: