
The US Dollar Index, or DXY, is holding near 102.10 after easing from an almost 18-month high during Tuesday’s European session. The index, which measures the US Dollar against six major currencies, remains technically bullish as it trades above its nine-day and 50-day exponential moving averages. However, a 14-day Relative Strength Index of 75.6 signals overbought conditions, raising the risk of a short-term pullback. Strong US services activity is also keeping the dollar supported as traders assess the outlook for interest rates.
DXY Holds Bullish Technical Structure
DXY remains above both its nine-day EMA at 101.60 and 50-day EMA at 100.37, keeping the near-term trend constructive. The index is also moving within an ascending wedge on the daily chart, a pattern that can support further gains while warning of a potential reversal as price approaches its upper boundary.
The immediate challenge is the October 6 high near 102.53. A decisive break above that level would expose the upper edge of the wedge around 102.80.
Momentum, however, is becoming stretched. The RSI at 75.6 is well above the conventional 70 threshold used to identify overbought conditions. This does not necessarily signal an immediate decline, but it indicates that the dollar may require stronger fundamental support to extend its advance without a consolidation phase.
- Resistance: 102.53, then 102.80
- Support: 101.70, 101.60 and 100.37
A break below the 101.70-101.60 support area would weaken the bullish structure and increase the probability of a deeper correction.
US Services Data Supports Dollar
The latest ISM Services PMI remained firmly above the 50 threshold that separates expansion from contraction. The index eased to 54.9 from 55.4, narrowly missing the 55.0 consensus forecast.
The details offered a mixed but still dollar-supportive picture. Business activity and new orders moderated, indicating that momentum has cooled. At the same time, stronger employment and order backlogs provided offsets, while prices paid reached a fresh high.
That combination matters for the Federal Reserve because resilient demand alongside renewed price pressures could make policymakers more cautious about easing monetary policy. Higher-for-longer rate expectations can support the dollar by keeping US Treasury yields relatively attractive.
The data therefore reinforce the fundamental backdrop behind DXY, even as technical indicators warn that the recent rally is becoming extended.
DXY Risks Correction Below 101.60
The key technical question is whether DXY can clear 102.53 without first undergoing a correction. A sustained move above that level would strengthen the bullish case and put 102.80 in focus.
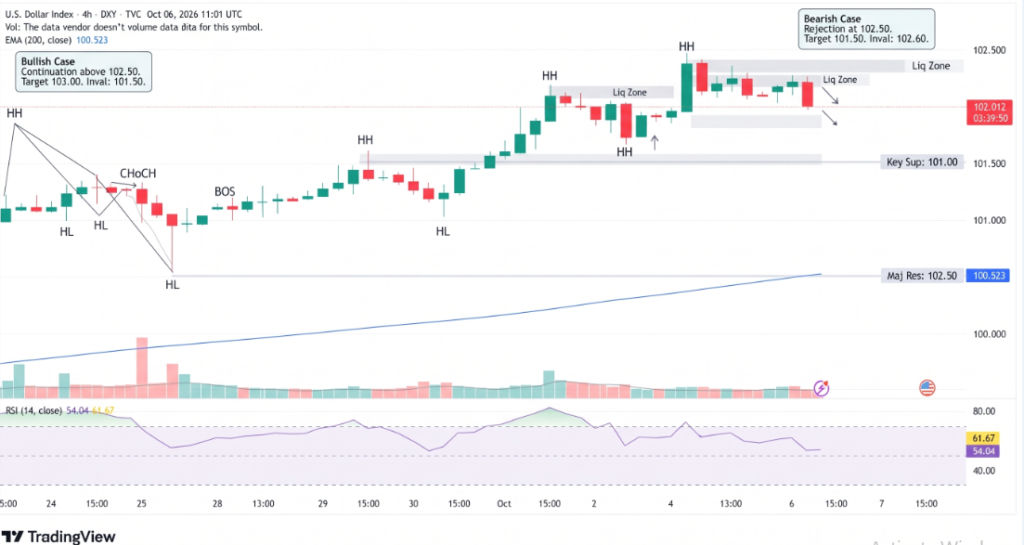
Conversely, rejection near resistance could push the index toward the 101.70 wedge boundary. A daily close below that area and the nine-day EMA at 101.60 would weaken the immediate uptrend.
The next major downside target would be the 50-day EMA at 100.37. If selling accelerates below that level, the August 20 four-month low at 98.56 would become the broader bearish objective.
Conclusion
The US Dollar Index remains firmly bullish near 102.10, supported by its position above key moving averages and resilient US services activity. Yet the 75.6 RSI shows that the rally is increasingly stretched. The 102.53-102.80 zone is therefore critical for bulls, while 101.70-101.60 represents the first important support area. A break in either direction could determine whether DXY extends its advance or enters a deeper correction.
Sources & Methodology
Primary-source standard: Market-moving facts should link to original data releases, regulator notices, company filings or official project announcements whenever available. Secondary reporting is used for additional context, not as a substitute for original evidence.
Page last reviewed: