
The NZD/USD pair remains under pressure near 0.5590 in Tuesday’s European session, with the New Zealand Dollar trading close to its lowest level since November 2025. Higher US Treasury yields, a firmer US Dollar and political uncertainty ahead of New Zealand’s November 7 election are weighing on the Kiwi. At the same time, the technical picture remains bearish despite an oversold Relative Strength Index (RSI), leaving downside risks intact.
RBNZ Rate Bets Support the Kiwi
Markets are pricing roughly a 58% probability of a 25-basis-point increase in the Reserve Bank of New Zealand Official Cash Rate to 3.0% at its October meeting. The RBNZ raised the OCR by 25 basis points to 2.75% in September and said further increases could be required if inflation pressures persist.
However, expectations for tighter New Zealand policy have not been enough to offset the dollar’s yield advantage. The November 7 general election is also adding uncertainty to the outlook, with recent polling showing a close contest between the major political blocs.
On the US side, traders are preparing for the September Federal Reserve meeting minutes due Wednesday. The release could clarify how policymakers assessed inflation and the need for additional tightening after the Fed raised its target range to 3.75%-4.00% in September.
Dallas Fed President Lorie Logan has argued that rates may need to rise another 50 basis points or more to make policy modestly restrictive. Her comments reinforce the dollar-positive backdrop, although other Fed officials have recently favored waiting for more data before another increase.
NZD/USD Technical Levels Turn Bearish
The daily chart shows NZD/USD trading below its 20-day Bollinger middle band and 100-day moving average, confirming persistent selling pressure. The RSI is near 24.5, indicating an oversold market, but an oversold reading alone does not establish a bullish reversal.
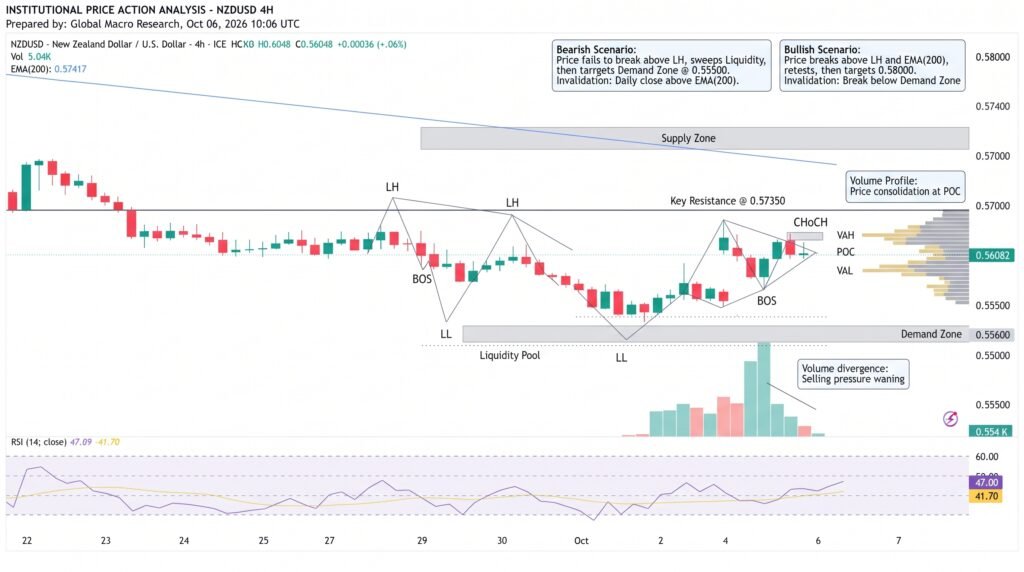
- Support: 0.5555, followed by 0.5520 and 0.5485
- Resistance: 0.5626, then 0.5700 and 0.5805
The 0.5555 lower Bollinger Band is the immediate downside level. A sustained break below it could expose the April 8, 2025 low at 0.5520, followed by 0.5485.
On the upside, a move above 0.5626 would ease immediate bearish pressure. A stronger recovery would need to reclaim 0.5700, where the 20-day Bollinger middle band currently sits. The 100-day moving average near 0.5805 and upper Bollinger Band around 0.5840 form a broader resistance zone.
Conclusion
NZD/USD remains technically vulnerable below 0.5600 despite deeply oversold momentum. Current market data also show the pair trading around 0.5590, while broader technical measures continue to indicate a bearish setup. The 0.5555 level is therefore critical: holding it could encourage a corrective rebound, while a decisive break would strengthen the case for 0.5520 and 0.5485. The Fed minutes and New Zealand’s policy outlook remain key near-term catalysts.
Sources & Methodology
Primary-source standard: Market-moving facts should link to original data releases, regulator notices, company filings or official project announcements whenever available. Secondary reporting is used for additional context, not as a substitute for original evidence.
Page last reviewed: