
West Texas Intermediate (WTI) crude oil traded around $92.45 on the five-hour chart, confined to a narrow range between $90.50 and $94.40. Weak directional momentum and repeated failures near resistance suggest that neither buyers nor sellers have established control. With the Average Directional Index (ADX) at just 11.05 and several Doji candles signaling indecision, traders face an elevated risk of false breakouts. A sustained move beyond the range could provide a clearer signal, while price action inside it remains vulnerable to sharp reversals.
WTI Oil Faces a Technical Standoff
WTI is caught between a resistance cluster overhead and several technical support indicators below. On the upside, the SuperTrend indicator places resistance near $93.32, while the 38.2% Fibonacci retracement level sits around $94.33. Repeated failures to clear this upper area suggest that buyers have yet to generate enough momentum to establish a sustained recovery.
Support is concentrated between $90.50 and $91.50, where the chart shows a convergence of moving averages, the Ichimoku Cloud and the 50% Fibonacci retracement. Multiple indicators pointing toward the same zone can make it an important area for traders to monitor, although they do not guarantee that the price will hold.
The ADX reading of 11.05 reinforces the range-bound outlook. ADX measures trend strength rather than whether prices are rising or falling. Readings below 20 are commonly associated with a weak trend, making directional signals less reliable. The repeated Doji candlesticks—where opening and closing prices are relatively close—also reflect a lack of conviction among market participants.
Key Levels Define the Trading Outlook
Until WTI breaks decisively out of its current range, the middle of the trading band offers limited directional clarity. Traders are watching several levels to assess whether momentum is shifting:
- Immediate resistance: $93.32, near SuperTrend.
- Major breakout zone: $94.33–$94.40, around Fibonacci resistance and the recent swing high.
- Initial support: $91.50, the upper boundary of the broader support area.
- Major support: $90.50, the lower boundary of the consolidation range.
- Trend confirmation: An ADX rise above 20 could indicate strengthening directional momentum.
A sustained move above $94.40 would suggest that buyers are overcoming the current resistance structure. Conversely, a decisive break below $90.50 would put sellers in a stronger position and signal that the existing consolidation may be ending.
Low Momentum Raises Whipsaw Risks
The primary risk is a breakout that quickly reverses. When trend strength is weak, prices can briefly cross important levels without attracting enough follow-through buying or selling to sustain the move. Low trading volume, if confirmed by the underlying chart, would further weaken confidence in such moves.
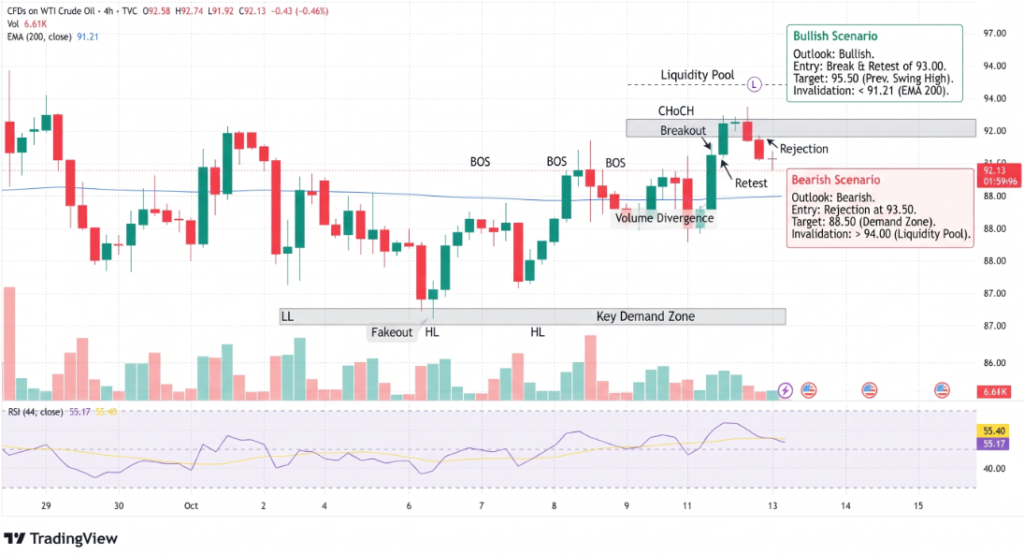
For this reason, the $91.50–$93.30 area remains a particularly difficult zone for directional trades. Waiting for a confirmed break and a successful retest may help traders distinguish a genuine move from short-lived volatility.
Conclusion
WTI crude oil remains trapped near $92.45, with support at $90.50–$91.50 and resistance at $93.32–$94.40. Weak ADX readings and repeated Doji candles point to indecision rather than a strong directional trend. A sustained breakout beyond either boundary, supported by stronger momentum, would provide a clearer signal. Until then, patience and careful risk management remain central to navigating the market.
Sources & Methodology
Primary-source standard: Market-moving facts should link to original data releases, regulator notices, company filings or official project announcements whenever available. Secondary reporting is used for additional context, not as a substitute for original evidence.
Page last reviewed: