
Natural gas is trading at $3.172 on the five-hour chart, with prices consolidating between support at $3.105 and resistance near $3.280. The pause follows a strong advance and may represent a bull flag, a technical pattern that can precede further gains. However, weakening short-term momentum complicates the outlook. A bearish MACD crossover and a Relative Strength Index (RSI) reading of 53.66 indicate that buying pressure has eased. Traders are watching for a confirmed breakout, as a move beyond the current range could establish the next directional trend.
Natural Gas Holds at $3.172
The natural gas market remains above its longer-term trend indicator, with the current price approximately 7.96% above the 200-period simple moving average (SMA), according to the supplied chart data. This supports the broader bullish structure, although it does not guarantee further gains.
The latest five-hour candle resembles a Doji, a formation in which opening and closing prices are close together. It often signals indecision when buyers and sellers struggle to establish control. The price is also near its 20-period moving average, reinforcing the importance of the next directional move.
Short-term indicators are less convincing. The MACD indicator has produced a bearish crossover, while the RSI has eased to 53.66. Although RSI remains above the neutral 50 threshold, the crossover suggests that upward momentum has weakened.
Support at $3.105 aligns with the SuperTrend indicator and the boundary of the Ichimoku cloud. The level has reportedly attracted buyers on three previous occasions. Resistance at $3.280 has been tested twice, leaving the market between established technical barriers.
Breakout Levels and Trading Scenarios
The potential bull flag remains incomplete. For the bullish case to gain credibility, natural gas needs to hold above $3.105 and break through the $3.265–$3.280 resistance zone. Stronger trading volume would help distinguish a genuine breakout from a temporary price spike.
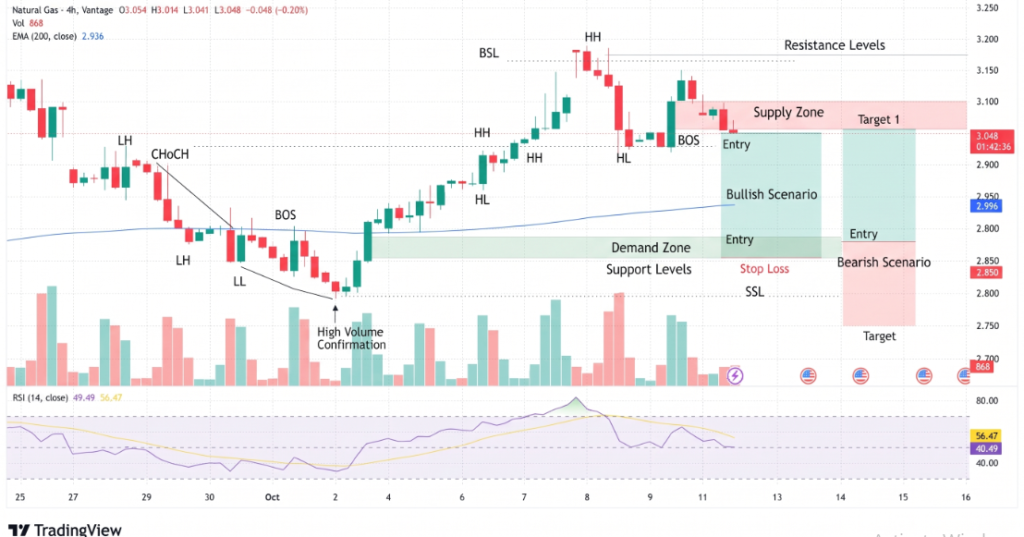
The main levels to monitor are:
- Bullish trigger: A confirmed break above $3.280 could expose $3.317, followed by $3.400.
- Bearish trigger: A close below $3.105 could bring $3.049 into view, followed by $2.966.
- Momentum warning: The bearish MACD crossover raises the risk of a failed upside breakout.
- Confirmation: Rising volume would strengthen the case for a sustained move in either direction.
The downside targets at $3.049 and $2.966 correspond to the 38.2% and 50% Fibonacci retracement levels identified in the supplied analysis. These levels can help traders assess potential pullbacks following a prior advance.
The $3.162–$3.260 range remains a difficult area for directional trades because prices are consolidating and short-term signals are mixed. A breakout without volume confirmation could reverse quickly, while a sustained move beyond the range would provide clearer evidence of market direction.
Conclusion
Natural gas remains above its longer-term moving average, but the consolidation near $3.172 reflects uncertainty about the next move. A decisive break above $3.280 could extend gains toward $3.317 and $3.400, whereas a drop below $3.105 would weaken the bullish structure and expose lower Fibonacci support. Until either boundary breaks convincingly, traders should treat the bull flag as a potential pattern rather than a confirmed continuation signal. Volume, momentum and five-hour closing prices remain essential to assessing the next move.
Sources & Methodology
Primary-source standard: Market-moving facts should link to original data releases, regulator notices, company filings or official project announcements whenever available. Secondary reporting is used for additional context, not as a substitute for original evidence.
Page last reviewed: