
Natural Gas is pressing higher near $3.263 on the 5-hour chart, but the rally is entering a technically stretched area. The supplied chart shows the Relative Strength Index (RSI) at 73.97 and the Money Flow Index (MFI) at 96, both pointing to exceptionally strong buying pressure. That does not automatically signal a reversal, but it raises the risk of a pullback if buyers fail to clear resistance.
The broader trend remains constructive. Current market data also show natural gas around $3.26, while recent technical readings continue to classify the market as strongly bullish.
The immediate ceiling is the $3.280-$3.317 region. The upper boundary coincides with the previous swing high near $3.317, making a decisive break important for determining whether the rally extends or loses momentum.
- Current chart price: $3.263
- Resistance: $3.280-$3.317
- First support: $3.151
- Major support: $3.105
Overbought Signals Raise Pullback Risk
The technical structure presents a clear conflict. Price remains above the long-term 200-period moving average near $2.918 in the supplied 5-hour setup, while the SuperTrend continues to support the bullish trend. However, momentum indicators have moved deep into overbought territory.
An RSI above 70 generally indicates that prices have risen rapidly relative to their recent trading range. The MFI reading of 96 is even more extreme, suggesting substantial buying pressure has accompanied the advance. A high reading alone is not a short signal, particularly during a strong trend, but it can make the market vulnerable to profit-taking.
The $3.317 peak is therefore critical. A failure below that level could reinforce a potential double-top structure, while a sustained break above it would weaken the bearish setup.
Fundamentally, the market also has competing forces. The U.S. Energy Information Administration estimates that U.S. gas inventories stood at 3.523 trillion cubic feet at the end of September and could reach 3.850 trillion cubic feet by the end of October, about 2% above the five-year average entering the heating season.
$3.151 Support Holds the Bullish Case
For bulls, the first important retracement level is $3.151, corresponding to the 38.2% Fibonacci level in the supplied chart. A controlled pullback toward that area could allow overheated momentum to reset without damaging the broader uptrend.
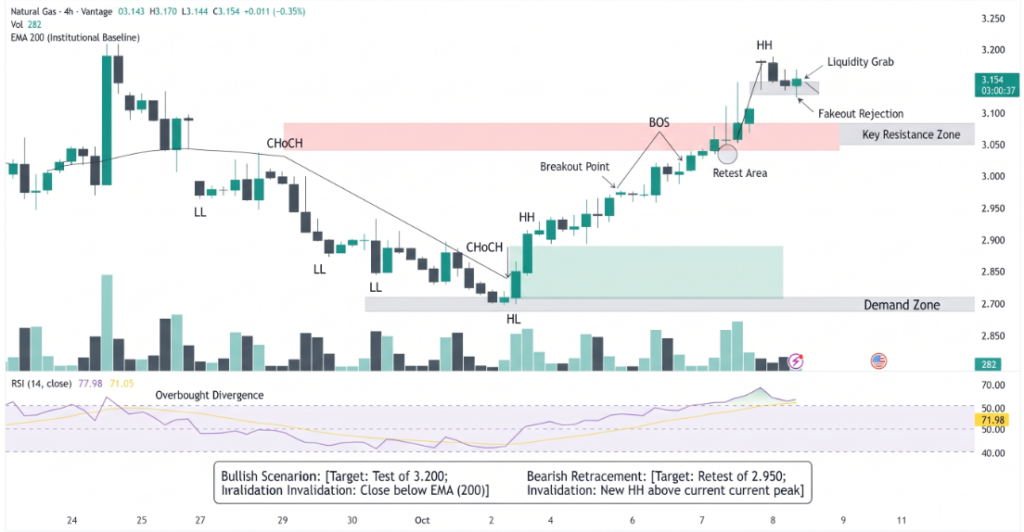
Below it, $3.105 becomes more important because the level combines the 50% Fibonacci retracement with the SuperTrend and 20-period SMA. A sustained break beneath that cluster would indicate that buyers are losing control and could expose deeper support.
For traders considering the next move, the cleaner signals are straightforward: a confirmed breakout above $3.317 would favor continuation, while rejection below that level would keep the mean-reversion setup alive.
Conclusion
Natural gas remains bullish, but $3.263 sits close to a significant technical barrier. RSI near 74 and MFI at 96 show that the rally is stretched, increasing the probability of volatility around $3.317. The broader trend remains constructive while price holds above key support, but chasing the market at resistance carries greater risk. A confirmed breakout above $3.317 would strengthen the bullish case; rejection could send prices toward $3.151 and potentially $3.105.
Sources & Methodology
Primary-source standard: Market-moving facts should link to original data releases, regulator notices, company filings or official project announcements whenever available. Secondary reporting is used for additional context, not as a substitute for original evidence.
Page last reviewed: