
Natural gas is pressing against the $3.162 area on the five-hour chart, putting the market at a critical technical juncture. The supplied setup shows strong upward momentum, with the major moving averages and SuperTrend aligned bullishly. But an exceptionally high Money Flow Index (MFI) reading of 95.2 warns that the rally is becoming stretched. Current market data also shows Henry Hub gas around $3.13, with five-hour technical signals still broadly bullish.
Natural Gas Tests $3.162 Resistance
The immediate battle is taking place around the 61.8% Fibonacci retracement near $3.162. This level is important because a sustained move above it would strengthen the case that the recent recovery is evolving into a broader upside move.
The technical structure remains supportive of buyers. The 20-, 50- and 200-period moving averages in the supplied five-hour setup are all rising, while the SuperTrend remains positive. The MACD is also signaling continued upside momentum.
However, the rally is increasingly stretched. An MFI reading above 80 is generally considered overbought, and the supplied reading of 95.2 points to intense buying pressure. Price is also pressing the upper Bollinger Band, increasing the probability of short-term profit-taking.
Current levels to monitor include:
- Immediate resistance: $3.162-$3.20
- Upside targets: $3.23 and $3.31
- Initial support: $3.10-$3.06
- Major downside level: $2.91
Bulls Face Overbought Conditions
The bullish case depends on whether natural gas can convert the $3.162 resistance into new support. A decisive break above $3.17, particularly with expanding volume, would confirm that buyers are willing to absorb selling near the Fibonacci barrier.
The next upside objective would be $3.23, followed by the recent $3.31 area. A stronger extension could eventually target $3.42, based on the Fibonacci projection in the supplied technical setup.
Yet the risk of a pullback is significant. The latest Investing.com technical data shows the broader five-hour setup as a Strong Buy, with the RSI around 72 and Stochastic indicators in overbought territory. That combination supports the trend but also shows how extended the market has become.
Fundamentals provide a mixed backdrop. The U.S. Energy Information Administration estimates U.S. natural-gas inventories at 3,523 billion cubic feet at the end of September and forecasts stocks to reach 3,850 Bcf by the end of October, about 2% above the five-year average.
$3.10 Break Would Shift the Bias
A failure at $3.162 followed by a move below $3.10 would weaken the immediate bullish structure. The next technical objective would be $3.06, where buyers could attempt to stabilize the decline. A deeper break could expose $2.91.
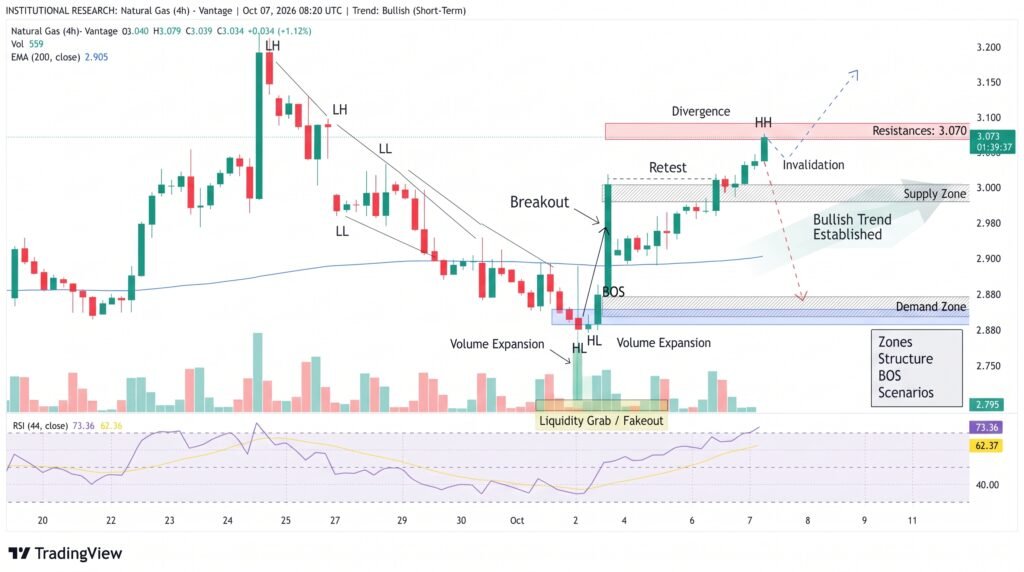
The $3.06-$3.16 region is therefore a difficult area for aggressive positioning because price can produce false breakouts and reversals while remaining inside the broader range.
Volume should provide an important confirmation signal. A breakout above $3.17 accompanied by expanding volume would strengthen the bullish case. Conversely, a sharp increase in volume during a move below $3.10 would suggest that sellers are gaining control.
The fundamental picture also matters as the market moves toward the winter heating season. The EIA expects above-average inventories entering the withdrawal season, which could provide a supply cushion. At the same time, weather, LNG exports and production remain important variables for Henry Hub pricing.
Conclusion
The Natural Gas Price Forecast remains bullish while prices hold above $3.10, but the $3.162 resistance zone presents a significant test. An MFI near 95 signals an unusually stretched market, making a pullback possible even if the broader trend remains positive. A confirmed break above $3.17 could target $3.23 and $3.31, while a move below $3.10 would shift attention toward $3.06 and potentially $2.91. Traders should prioritize confirmation and volume rather than chase an already extended move.
Sources & Methodology
Primary-source standard: Market-moving facts should link to original data releases, regulator notices, company filings or official project announcements whenever available. Secondary reporting is used for additional context, not as a substitute for original evidence.
Page last reviewed: