Natural Gas is trading around $3.084 on the five-hour chart, leaving bulls directly below the key $3.11 resistance level. The setup remains constructive because prices are above the 200-period simple moving average near $2.899 and above the Ichimoku Cloud. However, momentum is becoming stretched, with the Money Flow Index at 85.44.
The technical caution comes as the U.S. gas market enters the winter-storage buildup period with substantial inventories. The U.S. Energy Information Administration expects Lower 48 working gas inventories to reach 3,985 billion cubic feet by the end of October, about 5% above the five-year average.
Natural Gas Tests $3.11 Resistance
The $3.11 area is the immediate technical test for Natural Gas. A sustained close above this level would strengthen the bullish structure, particularly if trading volume expands alongside the breakout. Without that confirmation, the current rally remains vulnerable to profit-taking.
The Bollinger Bands reinforce the warning. Price is pressing against the upper band near $3.115, indicating that the market has moved toward the upper end of its recent trading range. The MFI reading of 85.44 also places buying pressure in traditionally overbought territory.
At the same time, the MACD remains bullish, showing that momentum has not yet turned decisively lower. This creates a market where both a breakout and a sharp mean-reversion move remain technically possible.
The fundamental backdrop is less supportive of an extended price surge. The EIA said U.S. natural-gas production rose 2%, or 2.7 billion cubic feet per day, during June-August from a year earlier, while storage injections remained generally strong.
Key Support Levels Below $3.11
If buyers push through $3.11, the next phase will depend on whether the breakout attracts fresh volume. A failed move above resistance, however, could send prices back toward the $3.01-$3.00 area, where the 20-period moving average and Fibonacci support converge.
The $2.97 region is more important if selling accelerates. It coincides with SuperTrend support and a previously tested floor, making it the next major area for buyers to defend.
- $3.115: Upper Bollinger Band and immediate breakout zone.
- $3.11: Major structural resistance.
- $3.01-$3.00: 20-period moving-average and Fibonacci support.
- $2.97: SuperTrend and deeper structural support.
The broader supply picture also limits the margin for error. The American Gas Association reported that strong production and elevated storage inventories are shaping the U.S. natural-gas outlook heading into winter. It cited an EIA forecast for nearly 112 Bcf per day of dry-gas production in 2026.
$3.02-$3.10 Defines the Choppy Zone
The $3.02-$3.10 region remains a difficult area for traders because it sits between meaningful support and resistance. Buying directly below $3.11 exposes bulls to a rejection, while aggressive shorting can be dangerous as long as the five-hour trend remains above its major moving averages.
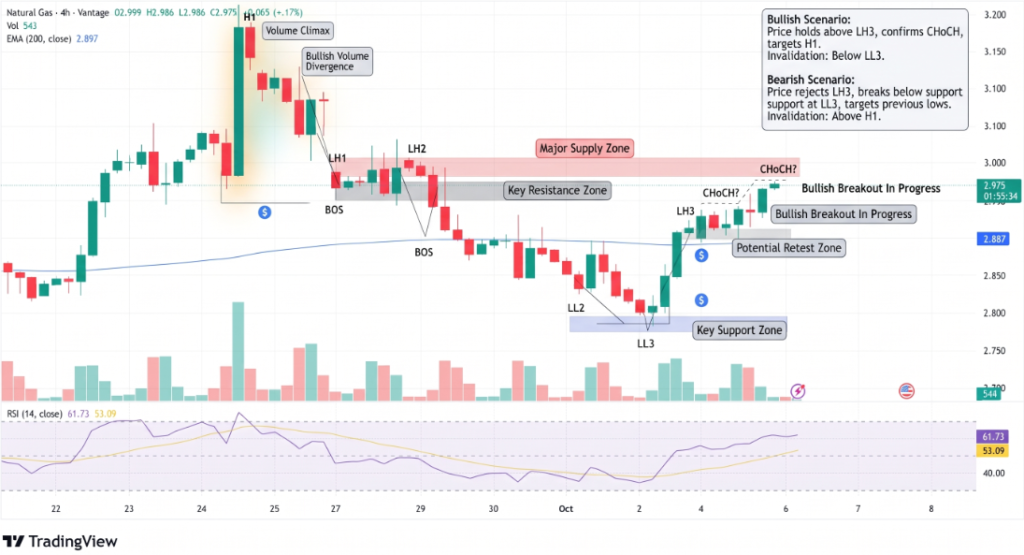
A decisive breakout above $3.11 with stronger volume would favor the bullish case. Conversely, a rejection followed by a break beneath $3.01 would increase the probability of a move toward $2.97 and potentially lower.
The Henry Hub market also remains sensitive to storage, production, weather and LNG demand. EIA previously forecast a third-quarter 2026 Henry Hub spot average of $2.87 per million British thermal units, citing robust production and reduced LNG feedgas demand.
Conclusion
Natural Gas is approaching a decisive technical point near $3.11. The bullish trend remains intact above $3.01 and particularly above the $2.97 support zone, but an MFI of 85.44 and price near the upper Bollinger Band warn that the rally is becoming stretched. A volume-backed break above $3.11 would strengthen the upside case, while a rejection could send prices toward $3.01 and $2.97.
Sources & Methodology
Primary-source standard: Market-moving facts should link to original data releases, regulator notices, company filings or official project announcements whenever available. Secondary reporting is used for additional context, not as a substitute for original evidence.
Page last reviewed: