
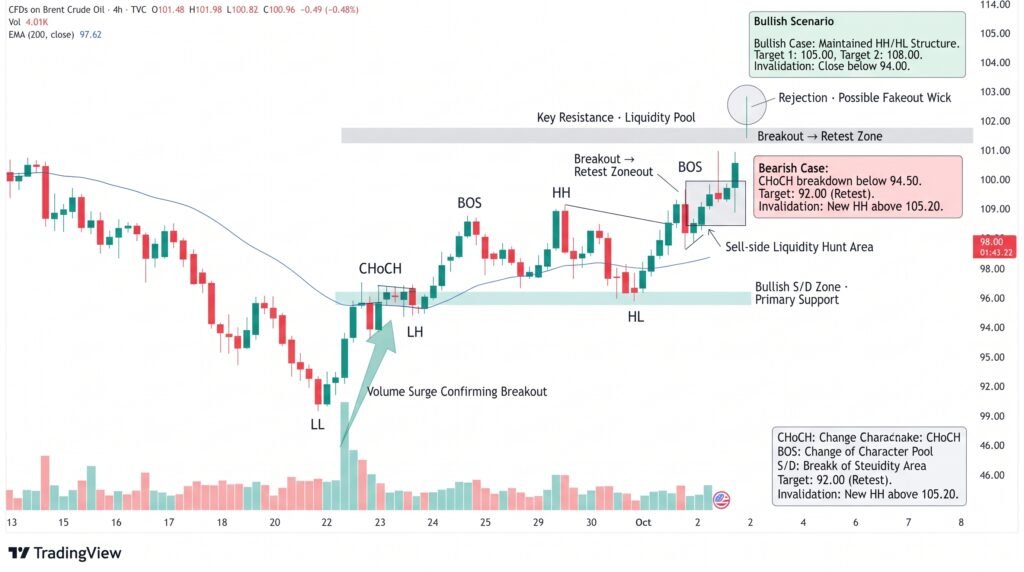
Brent Oil is trading around $101.57 on the 5-hour chart, caught between nearby technical support and resistance as traders assess conflicting supply and geopolitical signals. The price is sitting inside the Ichimoku cloud between roughly $100.36 and $101.68, a zone that often signals a lack of clear direction. A break above $102.50 or below $100.30 could provide the next directional signal.
The market is also responding to fresh supply developments. OPEC+ agreed to keep November production targets unchanged, while the G7 plans to release 100 million barrels of crude and diesel from emergency reserves. Reuters said rising Middle East exports and the planned stock release helped push oil prices lower on Monday despite continuing Gulf supply risks.
Brent Trapped Inside Ichimoku Cloud
Brent’s current position reflects a market caught between opposing forces. At $101.57, price remains inside the cloud, with the $100.36-$101.68 zone acting as a short-term equilibrium area. A move through either boundary could increase volatility as traders reposition around the breakout.
The technical picture is mixed. The MACD has crossed into positive territory, with the histogram around 0.401 versus 0.0484 previously. That shift indicates improving short-term momentum, although it has not yet produced a confirmed trend reversal.
Brent also remains above its 200-period simple moving average (SMA) near $96.39. Holding above that long-term trend measure keeps the broader bullish structure intact even as shorter-term price action remains indecisive.
At the same time, the SuperTrend is around $102.30, placing an important trend barrier directly above current price. The ADX at 15.29 shows that trend strength is weak, making false breakouts more likely.
$102.50 Break Could Set Direction
The $102.50 level is the main upside trigger. A sustained 5-hour close above it would move Brent beyond the immediate resistance structure and could signal that buyers are regaining control. The move would be more convincing if momentum and trading volume expanded alongside the breakout.
On the downside, $100.30 is the first major breakdown level. A move below that threshold would put the lower part of the Ichimoku cloud at risk and could shift attention toward the broader $95.50-$96.50 support zone.
The 23.6% Fibonacci retracement near $101.11 adds another technical reference point around current price. Its proximity to the cloud makes the $101 area an important short-term pivot.
- Immediate resistance: $102.30-$102.50
- Immediate support: $100.30-$101.11
- Major support: $95.50-$96.50
- Long-term trend: 200-SMA near $96.39
The market’s volatility profile also warrants caution. The Average True Range (ATR) is around 1.87, or approximately 1.8% of the current price. That indicates that a confirmed breakout could produce a relatively fast move.
Supply Risks Keep Oil Volatile
The fundamental backdrop remains unusually sensitive. OPEC+ has chosen to maintain November output targets, while geopolitical risks continue to threaten energy infrastructure and shipping routes. At the same time, the G7’s planned reserve release is expected to increase available supply and reduce some of the immediate pressure on consumers.
Saudi Arabia also unexpectedly cut November oil prices for Asian buyers to six-year lows, while raising prices for Northwest Europe and the Mediterranean. The move adds another layer to an already complicated physical oil market.
For Brent, this means technical signals may remain highly sensitive to headlines. Declining volume can make moves through $100-$102 more vulnerable to false breaks, particularly while ADX remains low.
Key levels to watch:
- Bullish trigger: Above $102.50
- Bearish trigger: Below $100.30
- SuperTrend resistance: $102.30
- Major downside zone: $95.50-$96.50
Conclusion
Brent remains locked in a narrow technical battle around $101.57, with the Ichimoku cloud highlighting the market’s indecision. Positive MACD momentum and price above the 200-SMA support the broader bullish case, but weak ADX and overhead SuperTrend resistance limit conviction. A sustained break above $102.50 would strengthen the upside setup, while a move below $100.30 would shift focus toward $96.39 and the $95.50-$96.50 support zone. Fundamental supply developments could determine which side wins the next move.
Sources & Methodology
Primary-source standard: Market-moving facts should link to original data releases, regulator notices, company filings or official project announcements whenever available. Secondary reporting is used for additional context, not as a substitute for original evidence.
Page last reviewed: