
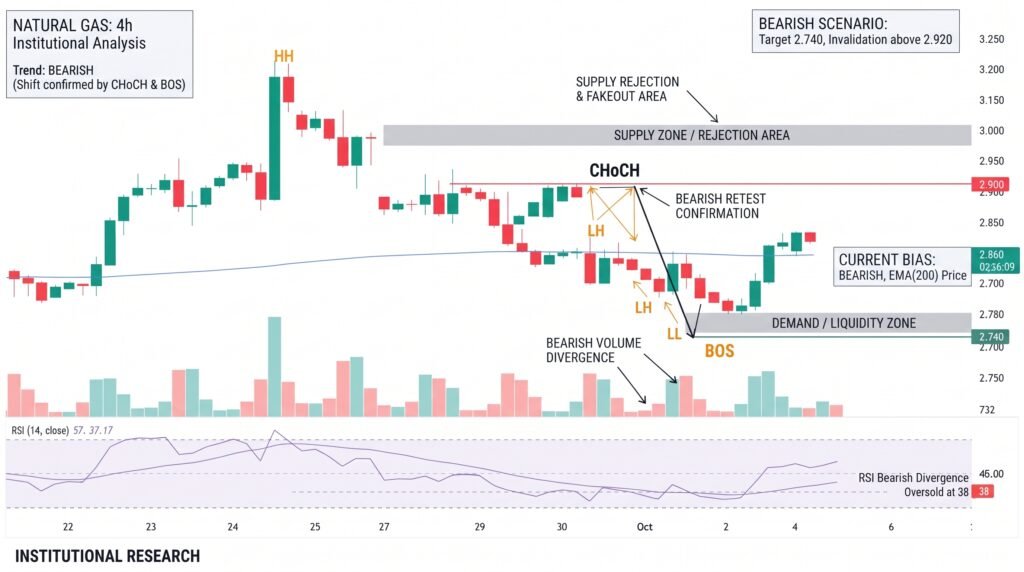
Natural Gas is hovering around $3.016 in the latest 5-hour technical setup, caught between weakening short-term momentum and a still-important long-term support base. The chart shows a 60%-formed bear flag, while price remains inside the Ichimoku cloud and below the 50-period SMA at $3.028. The setup leaves traders focused on $3.07 resistance and the $2.91-$2.92 support area for the next directional signal. Recent market data also show Natural Gas futures continuing to trade close to the psychologically important $3-per-million-Btu threshold.
Bear Flag Keeps Downside Risk Alive
The technical structure remains cautious after the sharp move lower in late September. Natural Gas is holding above the 20-period SMA near $2.999 and well above the 200-period SMA at $2.891, suggesting that the broader recovery has not completely failed. However, price remains below the 50-period SMA at $3.028, leaving the market without a clear short-term trend.
The 38.2% Fibonacci retracement near $3.067 adds another layer of resistance. A sustained move through $3.07 would weaken the bearish setup and indicate that buyers are regaining control. Until then, the developing bear flag remains relevant, particularly if a rise toward resistance is rejected.
Fundamentals provide a mixed backdrop. The U.S. Energy Information Administration (EIA) reported 3,415 billion cubic feet of working gas in storage for the week ended Sept. 25, a 64 Bcf weekly increase. Inventories were 138 Bcf below the year-earlier level but 79 Bcf above the five-year average.
$3.07 Resistance vs. $2.91 Support
The market’s immediate battle is concentrated inside a relatively narrow technical range. The $3.060-$3.080 zone combines the Ichimoku cloud top, the 38.2% Fibonacci retracement and the broader resistance structure. A decisive five-hour close above that region would challenge the bear flag and open the door to a stronger recovery.
On the downside, the $2.890-$2.920 area is the key defensive zone. It contains the 200-period SMA and a recent swing-low region, making it the primary level for bears to break if they want to restore downside momentum.
- Resistance: $3.060-$3.080
- Key support: $2.890-$2.920
- Bullish invalidation of the bearish setup: above $3.070
- Bearish momentum confirmation: below $2.910
The 5-hour ATR stands near 0.0459, or about 1.52%, indicating relatively contained volatility. That compression can make a confirmed breakout more significant because price has less room to move inside the current range.
Weather and Storage Add to the Risk
Fundamental traders also have to watch weather expectations as the market moves deeper into autumn. The NOAA October-November-December outlook favors above-normal temperatures across much of the eastern United States, a factor that can limit heating demand if the pattern persists.
That backdrop could make a sustained rally harder unless production, LNG demand or colder weather changes the supply-demand balance. Recent trading has already reflected sensitivity to weather and storage expectations, with futures remaining close to $3/mmBtu.
For traders, the $2.980-$3.050 area remains a practical no-trade zone. Price movement inside that band risks producing false breaks while the market remains compressed between its short- and long-term averages.
Conclusion
Natural Gas remains technically undecided at $3.016, but the risk is asymmetric around the major chart boundaries. A five-hour close above $3.07 would undermine the bear flag, while a break below $2.91 would strengthen the bearish case and expose the $2.89 area. Until either level gives way, waiting for confirmation is more defensible than trading inside the compressed $2.98-$3.05 range.
Sources & Methodology
Primary-source standard: Market-moving facts should link to original data releases, regulator notices, company filings or official project announcements whenever available. Secondary reporting is used for additional context, not as a substitute for original evidence.
Page last reviewed: