
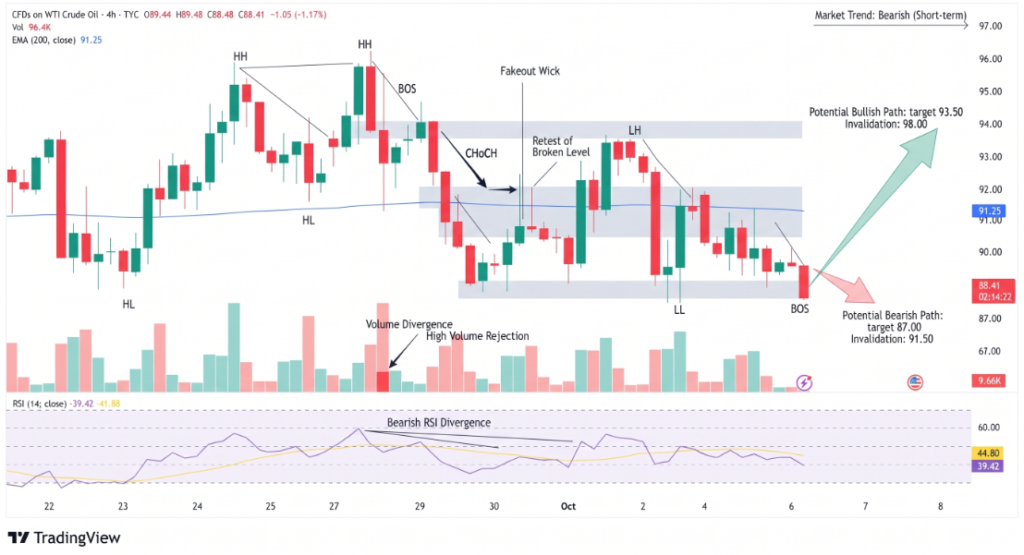
WTI crude oil is under renewed pressure near $88 after losing key technical support on the five-hour chart. WTI futures were around $88.78 on October 6, while the market has remained volatile as stronger Middle Eastern crude exports and planned strategic oil reserve releases ease immediate supply concerns.
The technical analysis picture is increasingly defensive. A break beneath the 50% Fibonacci retracement and the 200-period moving average leaves $88 as the next critical level. If sellers force a sustained move below that floor, the chart opens the way toward the $84.50 area.
WTI Tests Critical $88 Support
WTI is trading close to $88, with the $88.00 threshold now acting as the first major test for buyers. The 50% Fibonacci retracement near $88.76 has shifted into resistance, while the 200-period moving average sits considerably higher around $90.46. That combination creates a clear technical barrier for any recovery attempt.
The broader oil market is also facing softer supply pressure. Reuters reported that Middle Eastern crude exports excluding Iran recovered to more than 81% of pre-war levels in September, while the G7 agreed to release 100 million barrels from emergency reserves. Those developments have reduced some of the immediate shortage premium in crude prices.
Momentum indicators remain bearish but are approaching levels where a short-term rebound cannot be dismissed. The five-hour RSI is around 38.54, showing weak momentum without yet reaching conventional oversold territory.
Bearish Targets Point Toward $84.50
The technical structure favors sellers while WTI remains below $90.46. The MACD remains negative, with the indicator around -0.853 against a -0.714 signal line, confirming that downside momentum remains active.
A descending triangle structure also keeps the risk tilted lower if $88 gives way decisively. The next important Fibonacci reference is the 61.8% retracement near $84.52, making the $84.50 region the primary downside objective.
Key levels for traders include:
- $90.46: 200-period moving-average resistance.
- $88.76: 50% Fibonacci resistance after the breakdown.
- $88.00: Immediate psychological and technical support.
- $84.52: 61.8% Fibonacci downside target.
The setup becomes less bearish if WTI quickly recovers $89 and establishes closes above that level. Such a move could trap late sellers and trigger short covering toward the $90.46 moving average.
$88-$89.50 Remains a No-Trade Zone
The $88-$89.50 area is likely to remain volatile because it sits between immediate support and the first layer of recovery resistance. A brief move below $88 would not automatically confirm a larger decline; traders would need to see sustained closes below the level and follow-through selling.
The fundamental backdrop also argues for caution. U.S. crude production reached a record weekly 13.955 million barrels per day in late September, according to the U.S. Energy Information Administration, while the Dallas Fed latest survey showed producers expect WTI to average about $88 by year-end.
Conclusion
WTI crude oil remains vulnerable while prices stay below the $90.46 200-period moving average. A decisive break below $88 would strengthen the bearish setup and expose $84.52 as the next major Fibonacci target. However, a rapid recovery above $89 could weaken the breakdown and force short sellers to cover. For now, $88 is the level that separates a potential stabilization from another leg lower.
Sources & Methodology
Primary-source standard: Market-moving facts should link to original data releases, regulator notices, company filings or official project announcements whenever available. Secondary reporting is used for additional context, not as a substitute for original evidence.
Page last reviewed: