
Silver has fallen through the psychologically important $60 level, reinforcing the bearish structure that has developed across the precious-metals market. Spot XAG/USD was around $58.92 on Oct. 8, down about 1.45% on the day, after reaching an intraday low of $58.73. Silver futures were also trading near $59.16, extending the recent decline.
The move follows a 3.12% decline on Oct. 7, when spot silver fell from $61.57 to close near $59.78. That breakdown pushed the metal decisively below $60, a level that had previously acted as important support. Market data also show silver has dropped from a three-month high near $71.16, highlighting the scale of the correction.
The broader macro backdrop is adding pressure. Higher U.S. Treasury yields and a firm U.S. dollar have reduced demand for non-yielding precious metals. Reuters reported Thursday that silver fell 2.2% as gold also remained under pressure from higher yields and dollar strength.
$58.46 Becomes the Next Target
On the 5-hour setup, the completed bear-flag breakdown points to $58.46 as the next technical objective. That level is particularly important because it sits close to the lower support area identified by recent market structures.
The bearish case is strengthened by price trading below its major moving averages. Current market data show daily 20-, 50- and 100-period averages substantially above the market, indicating that sellers retain control across multiple time frames.
Still, the decline is becoming stretched. An RSI reading around 35 in the supplied 5-hour setup leaves room for a short-term rebound before another leg lower. Traders therefore need to distinguish between a temporary oversold bounce and a genuine recovery above broken support.
Key levels to watch:
- Immediate resistance: $60.00-$60.50
- Downside target: $58.46
- Major swing support: $55.00
- Bearish invalidation: $62.55
Silver Risk Zones and Trade Setup
A sustained move below $58.46 would strengthen the argument for a deeper decline toward $55, which has served as a significant three-month low. However, a fast recovery above $60 would weaken the immediate bearish setup and signal that the breakdown may have lacked follow-through.
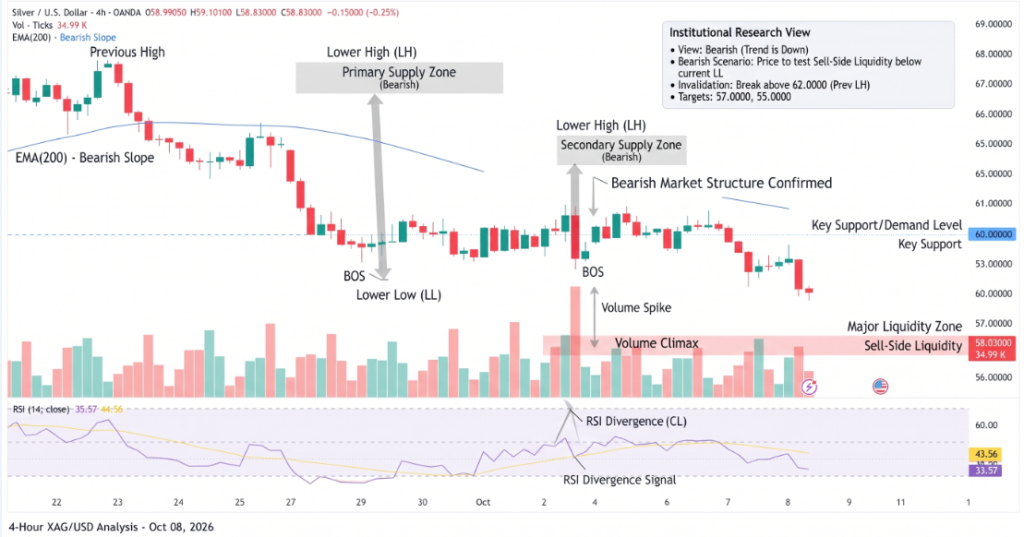
For traders, the $58-$58.50 area is the key decision zone. A failed breakdown followed by a strong rebound could produce a short-covering move, while a clean break below $58.46 would expose the next major downside area.
The preferred bearish scenario remains a rally toward $60.50-$61.00 followed by renewed selling, provided resistance holds. Conversely, a sustained close above $62.55 would materially weaken the bearish structure and force traders to reassess the downside thesis.
Conclusion
Silver’s break below $60 has shifted the near-term technical balance toward sellers. With spot prices already below that psychological threshold, $58.46 is the immediate level to monitor, while $55 represents the larger downside target if selling accelerates. The main threat to bears is an oversold rebound, particularly if silver quickly reclaims $60. For now, resistance around $60-$61 remains critical to determining whether the breakdown develops into a deeper correction.
Sources & Methodology
Primary-source standard: Market-moving facts should link to original data releases, regulator notices, company filings or official project announcements whenever available. Secondary reporting is used for additional context, not as a substitute for original evidence.
Page last reviewed: