
Gold (XAU/USD) is attempting to stabilize after Wednesday’s sharp decline, with the metal recovering from a two-month low near $4,066. The latest market data puts spot gold around $4,116, while the supplied 5-hour chart shows a recent price near $4,149.8. The broader technical structure remains bearish, however, as gold continues to trade well below its recent peak near $4,755.
The immediate battle is centered on the $4,091.2 support area. This level becomes particularly important because it sits close to the 78.6% Fibonacci retracement at $4,132.5 and the lower Bollinger Band around $4,112.3. A sustained break below $4,091 would weaken the case for a short-term recovery and expose lower technical targets.
The broader market backdrop also remains challenging. Higher U.S. Treasury yields and a firmer U.S. dollar have recently reduced demand for non-yielding gold, while traders continue to assess the Federal Reserve’s next policy moves.
$4,242 Resistance Caps Gold
The technical picture continues to favor sellers while gold remains below major trend indicators. The 200-period moving average sits around $4,403.8, while the SuperTrend indicator is near $4,242.5. These levels create a significant resistance band that bulls must reclaim before the short-term bearish structure can be challenged.
The Ichimoku Cloud also reinforces the defensive setup, with its lower boundary around $4,163.4 and the upper area near $4,221.4. Gold would therefore need to regain this region before momentum begins to shift more convincingly toward buyers.
- Support: $4,091.2, followed by $4,030 and $3,963.
- Resistance: $4,163–$4,221, then $4,242.5 and $4,403.8.
Momentum indicators offer limited relief. The MACD histogram has narrowed to about -0.18, suggesting that selling pressure is losing some intensity. However, the absence of a clear bullish divergence means the signal does not yet establish a durable reversal.
Gold Breakout or Further Downside?
Volatility is also contracting. The Average True Range (ATR) stands near 36.55, indicating that price swings have moderated after the recent selloff. Such compression can precede a larger move, making the $4,091 support and $4,242.5 resistance particularly important levels to monitor.
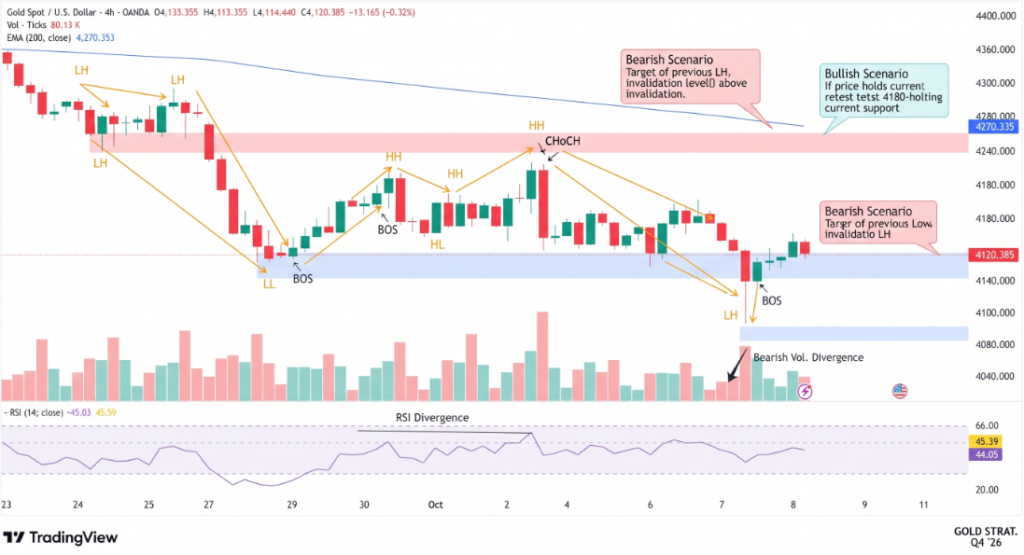
GOLD Price Chart – Source: Tradingview
A decisive close below $4,091 would reinforce the bearish structure and place $4,030 in focus, followed by the previous swing-low area around $3,963. Conversely, reclaiming $4,242.5 would weaken the immediate bear case and could open the way toward the $4,400 area.
For now, the evidence favors caution rather than aggressive countertrend positioning. Gold remains below its key trend indicators, while the U.S. dollar and elevated yields continue to weigh on the metal.
Conclusion
Gold’s recovery remains fragile while XAU/USD trades below $4,242.5. The $4,091 support is the decisive near-term level: a break could accelerate losses toward $4,030 and $3,963, while a sustained rebound above resistance would provide the first meaningful signal that sellers are losing control.
Sources & Methodology
Primary-source standard: Market-moving facts should link to original data releases, regulator notices, company filings or official project announcements whenever available. Secondary reporting is used for additional context, not as a substitute for original evidence.
Page last reviewed: