Natural gas is trading at $3.133 on the five-hour chart, close to critical support between $3.100 and $3.105. Selling pressure has intensified following a retreat from $3.317, while bearish momentum indicators point to continued downside risks. However, the price remains above its 200-period moving average at $2.928, leaving the broader recovery structure intact. Traders are watching whether buyers can defend support or a decisive breakdown will expose lower technical levels.
Natural Gas Tests Critical Support
The latest decline has placed natural gas prices between support near $3.105 and immediate resistance at the 20-period simple moving average of $3.144. The SuperTrend indicator and the base of the Ichimoku Cloud also identify the $3.105 area as an important technical barrier.
The retreat from $3.317 has produced a lower high, a pattern that can signal weakening buying pressure. Meanwhile, a bearish MACD crossover indicates that short-term momentum has shifted in favor of sellers.
Despite these warning signs, the longer-term technical picture has not completely deteriorated. Prices remain above the 200-period moving average at $2.928, which traders use to assess the broader trend. Holding above that level would preserve the possibility of another recovery, although it would not guarantee an advance.
Breakdown Risks and Key Price Levels
A five-hour candle close below $3.100 would strengthen the bearish case and could trigger additional selling. The next potential support areas are identified by Fibonacci retracement levels, which measure how far a market has pulled back from a previous price move.
The main technical reference points are:
- $3.180: Resistance where renewed selling could halt a rebound.
- $3.144: The 20-period moving average and immediate resistance.
- $3.105–$3.100: Critical support and the immediate breakdown threshold.
- $3.049: The 38.2% Fibonacci retracement level.
- $2.966: The 50% retracement level.
- $2.928: The 200-period moving average and a broader trend reference.
A sustained break below support could expose the lower levels, but technical targets are not guaranteed prices. Conversely, a strong rebound from $3.105 would suggest that buyers remain active.
Volume and Momentum Set the Outlook
Recent trading volume reportedly reached approximately 156,000 contracts during the decline, suggesting substantial market participation. However, volume alone cannot establish whether institutional investors are driving the move or indicate its future direction.
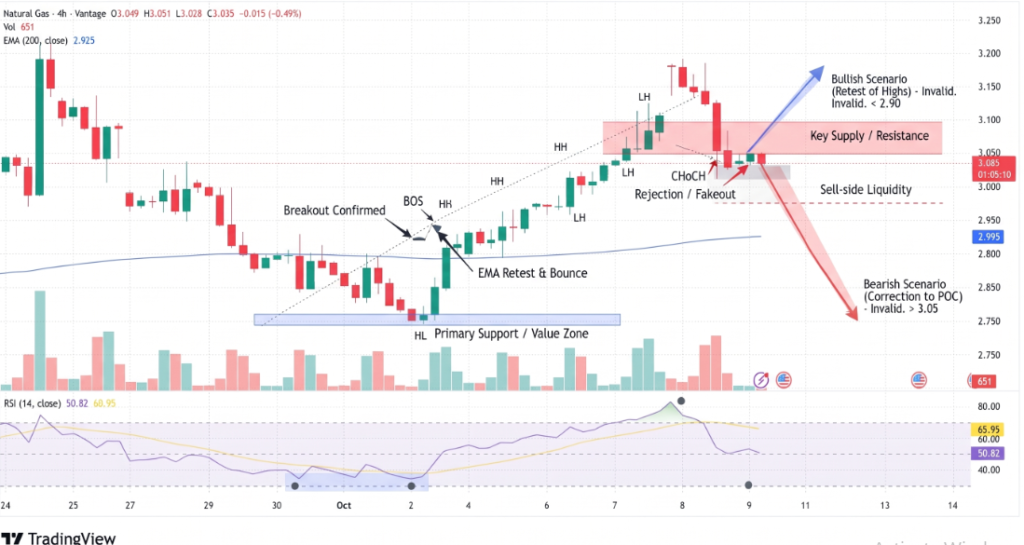
The Average True Range (ATR) stands at 0.0511, or roughly 1.63% of the current price. This measure reflects recent price volatility rather than forecasting a specific move. It nevertheless highlights the potential for sharp price swings around major technical levels.
Conclusion
Natural gas remains at a decisive technical point near $3.105. A confirmed break below $3.100 could expose $3.049 and $2.966, while a rebound toward $3.144 and $3.180 would give buyers an opportunity to challenge resistance. The 200-period moving average at $2.928 remains an important broader reference. Price confirmation and volume will be essential in distinguishing a genuine breakout from another short-lived move within the current range.
Sources & Methodology
Primary-source standard: Market-moving facts should link to original data releases, regulator notices, company filings or official project announcements whenever available. Secondary reporting is used for additional context, not as a substitute for original evidence.
Page last reviewed: