Natural gas traded near $3.173 on the five-hour chart, as buyers and sellers contested a key technical support zone. The price remains above its 200-period simple moving average (SMA) at $2.951, preserving the broader upward structure, but short-term momentum has weakened. Support from the Ichimoku Cloud and SuperTrend indicator is competing with a bearish Moving Average Convergence Divergence (MACD) crossover. A sustained break below $3.10 could expose lower levels, while a successful defense of support may reopen the path toward $3.27 and beyond.
Natural Gas Signals Remain Mixed
The latest chart presents conflicting signals. Natural gas is trading above its 200-period SMA at $2.951, a level that helps traders assess the broader trend. However, recent closes below the 20-period SMA at $3.183 point to weakening short-term momentum.
The SuperTrend indicator sits near $3.105, while the Ichimoku Cloud spans approximately $3.105 to $3.174. This overlap places the current price close to a technical decision point, where a break in either direction could influence short-term positioning.
A Doji candle near $3.178, reported on October 13, adds to the uncertainty. Doji candles form when opening and closing prices are relatively close, reflecting a balance between buying and selling pressure during that period. Combined with the bearish MACD crossover, the pattern suggests caution rather than a confirmed resumption of the uptrend.
Key Support and Resistance Levels
Traders are watching whether natural gas can defend the $3.10 area or whether sellers force a deeper correction. The most important technical reference points are:
- Immediate support: $3.105–$3.110, around the cloud base and SuperTrend.
- Critical breakdown level: $3.100, where a sustained close below could strengthen the bearish outlook.
- Additional support: $3.05, followed by $2.966, $2.884 and $2.800.
- Initial resistance: $3.27, the next major hurdle for buyers.
- Higher upside targets: $3.317 and $3.45 if bullish momentum returns.
A rebound from the cloud base could support a move toward $3.23 and then $3.27. A sustained breakout above that resistance would improve the case for further gains toward $3.317. However, these targets depend on price confirmation; they are not guaranteed outcomes.
On the downside, a clear close below $3.10 would weaken the bullish structure and bring $3.05 into focus. Continued selling could expose the lower support levels, particularly if momentum indicators turn more decisively bearish.
Volatility Raises Breakout Risks
The reported Average True Range (ATR) is 0.0513, equivalent to roughly 1.6% of the current price. ATR measures typical price movement, not market direction, but this reading suggests that moves can be significant relative to the current price.
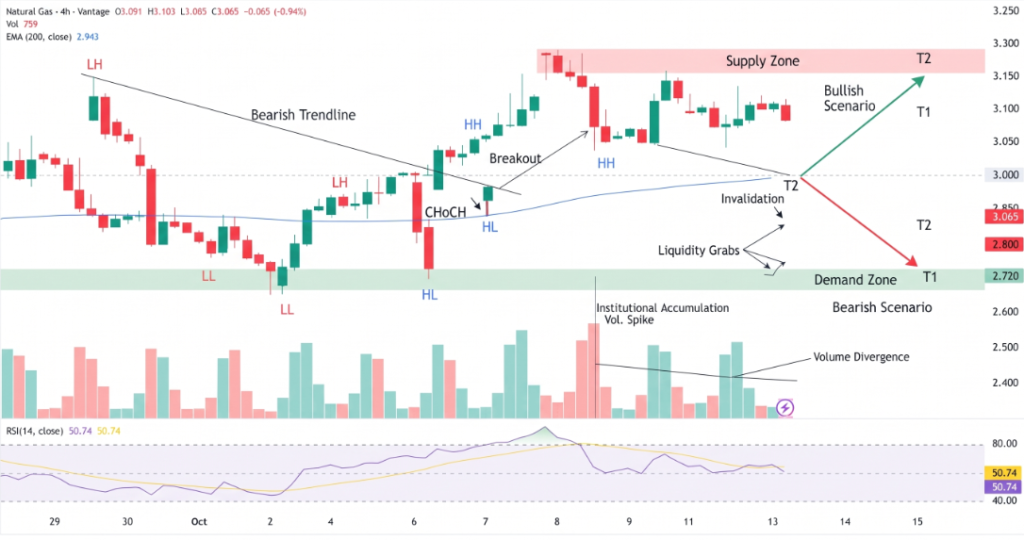
Trading volume has reportedly declined as consolidation has developed. A volume increase alongside a confirmed break could help distinguish a sustained move from a brief price spike. The $3.15–$3.20 zone remains a difficult area for directional entries because price is near the middle of the current support-resistance structure.
Conclusion
Natural gas remains near $3.173, with technical support and weakening momentum pulling in opposite directions. The $3.10 level is the immediate downside test, while $3.27 represents the next important resistance. A confirmed break supported by stronger volume would provide a clearer signal than the current consolidation. Until then, traders should treat both bullish and bearish scenarios as conditional rather than established trends.
Sources & Methodology
Primary-source standard: Market-moving facts should link to original data releases, regulator notices, company filings or official project announcements whenever available. Secondary reporting is used for additional context, not as a substitute for original evidence.
Page last reviewed: